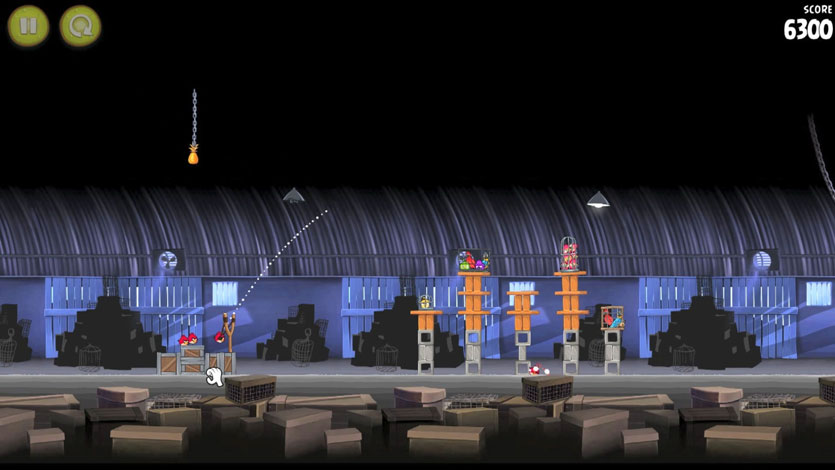
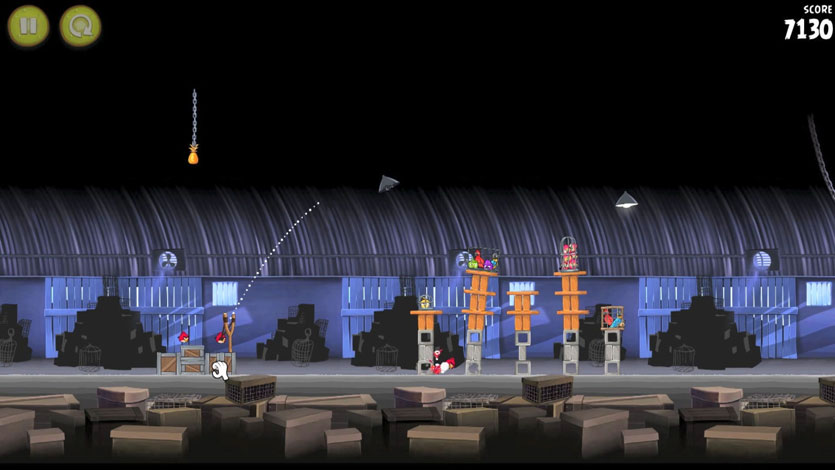
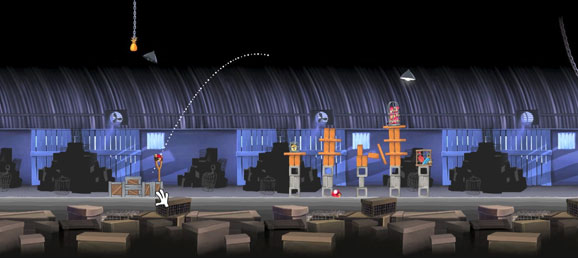
- Where would the Angry Birds have hit the ground if they hadn’t crashed into anything on the way?
- What is a guess that is too close?
- What is a guess that is too far?
- What is your best guess?
- What would be a way to help us have locations that are easier to communicate to each other?
- What are the coordinates for your best guesses?
- What information would do you need to figure this out?
- What factors may affect your answer’s accuracy?
- Angry Bird #1 (without grid)
- Angry Bird #2 (without grid)
- Angry Bird #3 (without grid)
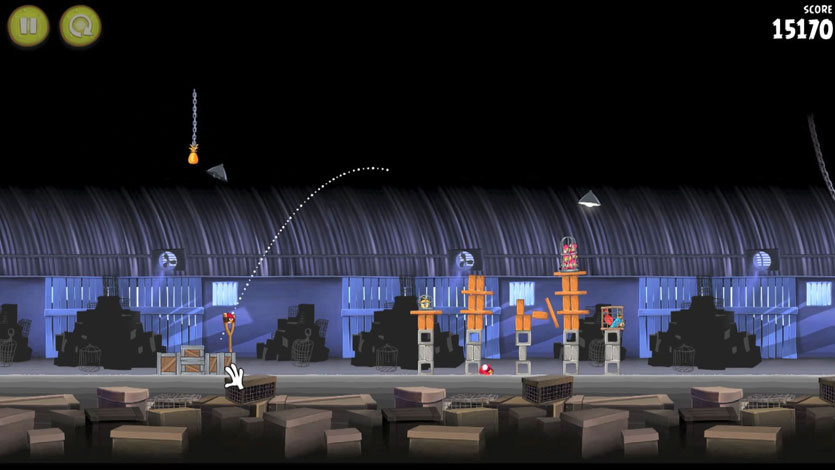
Without a coordinate plane, students will not have uniform answers. Instead you may hear things like “The bird will land in between the second and third column.” This provides the opportunity to ask students “What would be a way to help us have answers that are easier to communicate to each other?” Hopefully students will come up with the idea of needing a coordinate plane. Now you can introduce the screenshots with the grids and ask students “What are the coordinates for your best guesses?”.
- Angry Bird #1 (with grid)
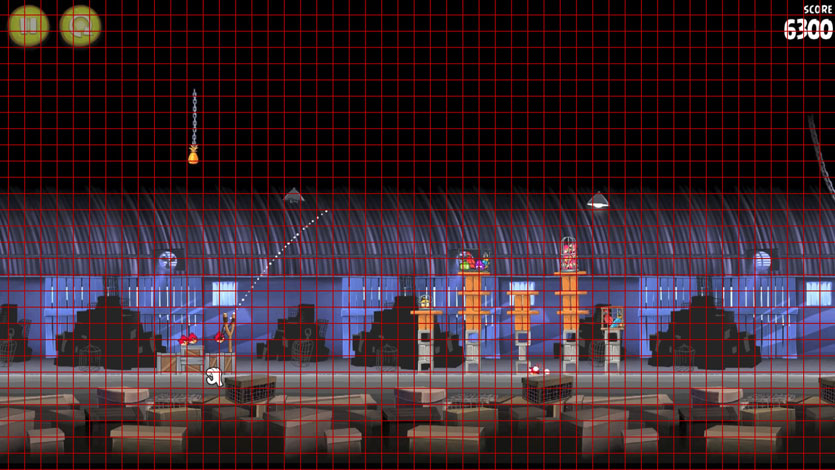
- Angry Bird #2 (with grid)
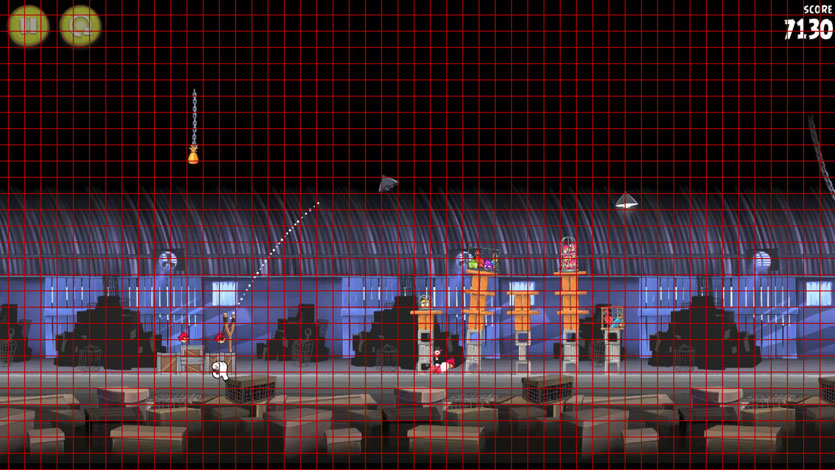
- Angry Bird #3 (with grid)
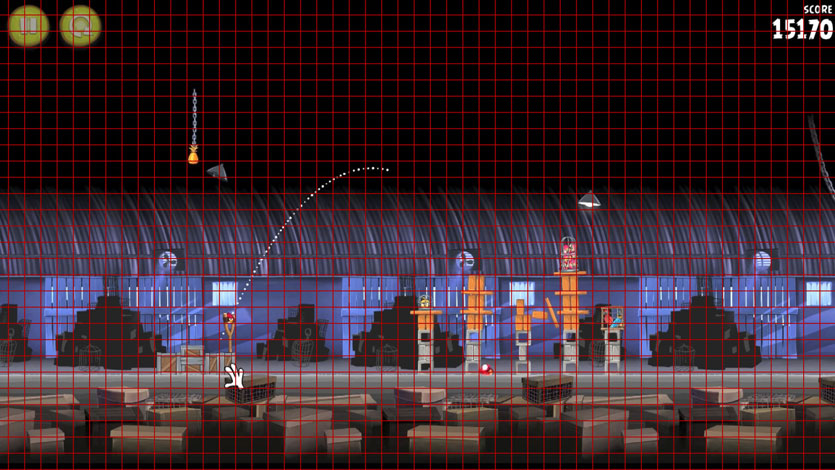
This, however, will introduce another problem because the grids are not numbered. So, students will have to decide on where the origin will be and number from there. Note that if students cannot agree on where to place the origin, it may be worthwhile to let different groups try different origins. If students write the equation in the form y = a(x – h)^2 + k, then each of the groups should have the same value for a (parabolic shape) even if their h and k (vertex coordinates) values are different.
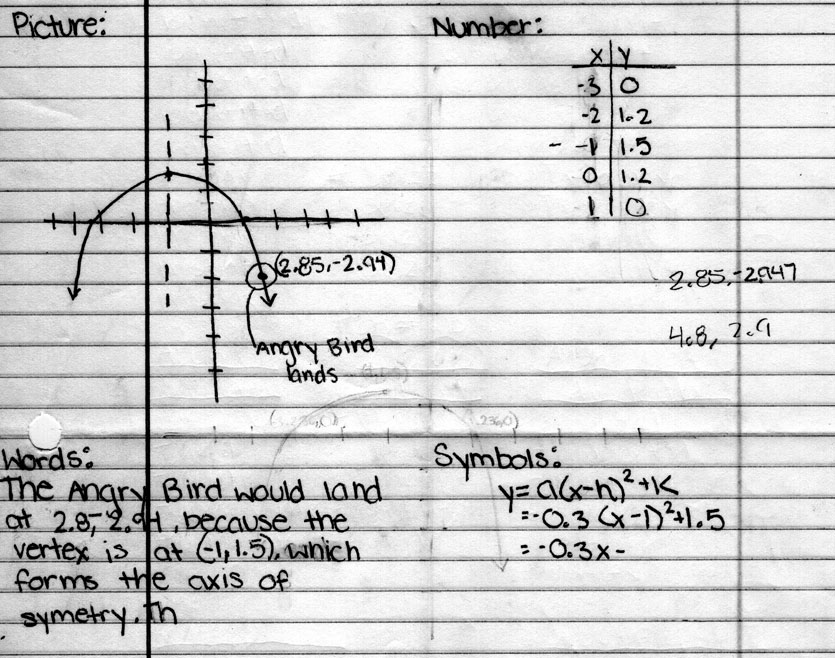
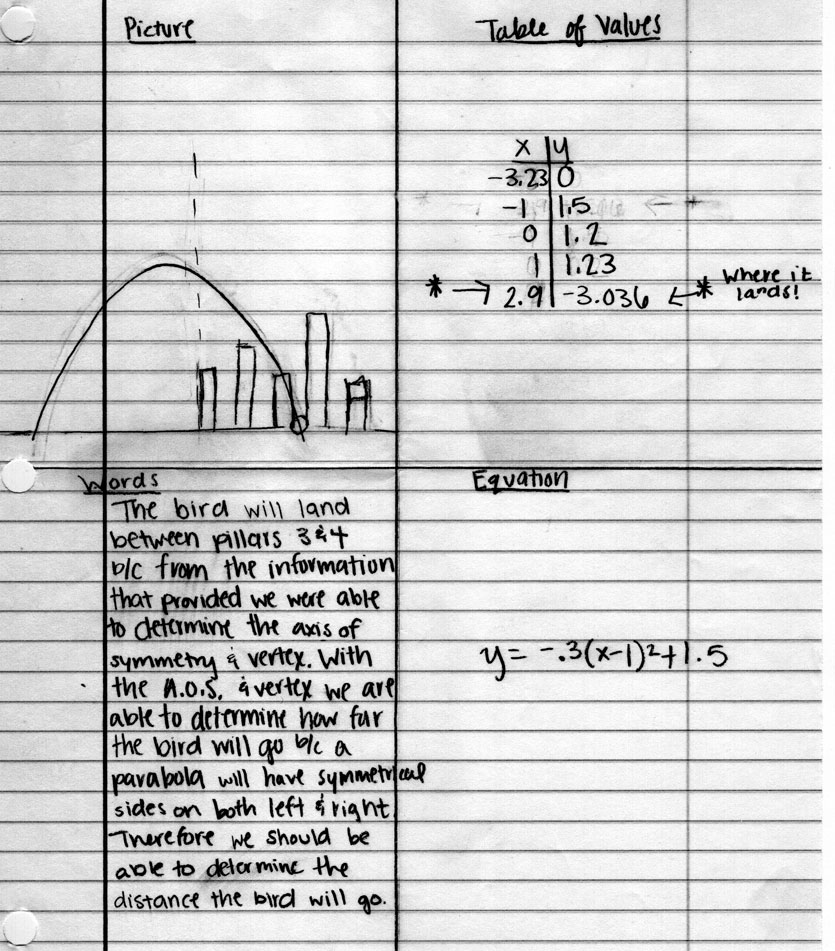
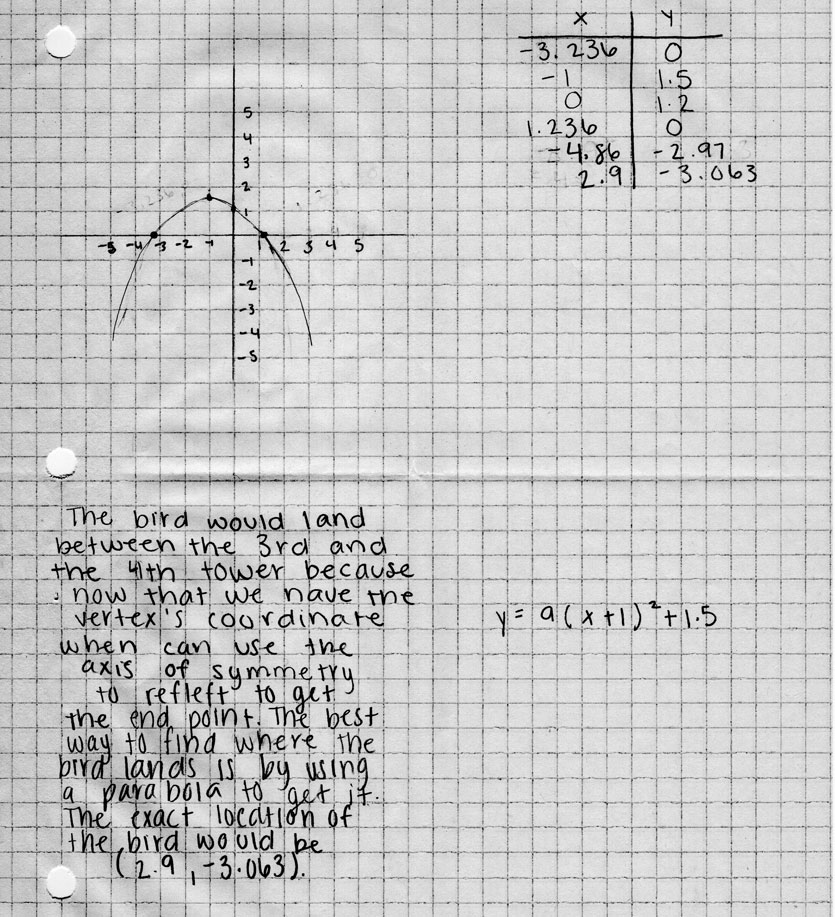
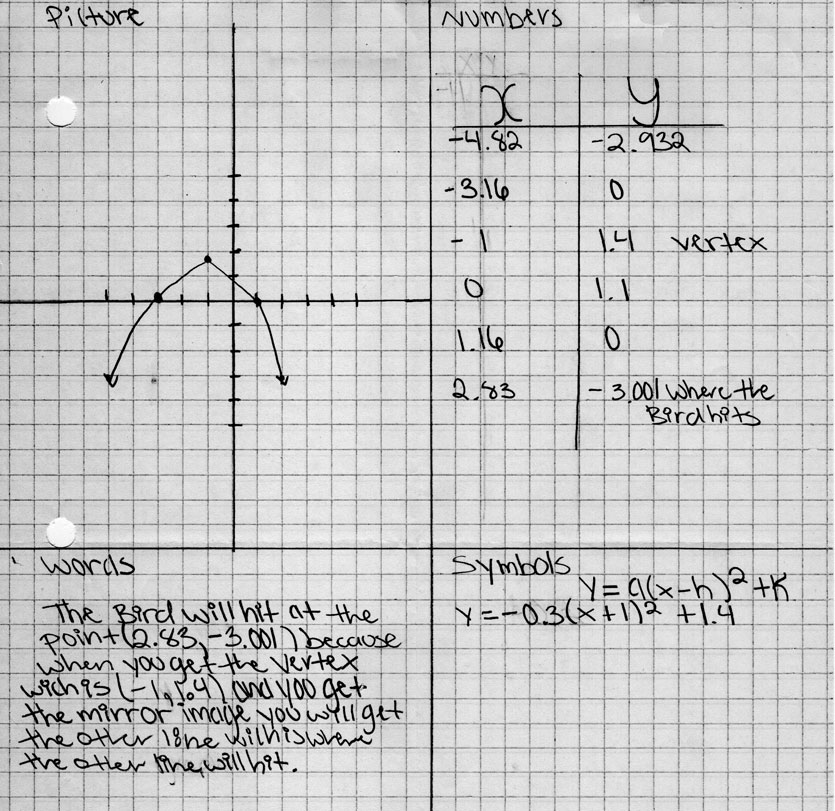
Once students realize that they must know the vertex to have an accurate landing place, students should be able to realize that we have insufficient information for Angry Birds 1 and 2. Angry Bird 3 is the only one with a vertex in its graph, so it is best to move forward with that screenshot and overlaid grid. Students may try a variety of strategies including reflecting one side of the parabola over to the other or wanting to use Algebra. The goal is to eventually make sure students are able to use what they know (the coordinates of the vertex and the coordinates of an x-intercept) and the formula y = a(x – h)^2 + k to find out where Angry Bird 3 would have landed.
When I tried to find where it would have landed, I placed the origin slightly left and down from the slingshot so that the origin was where the first white dots on the parabola began. The image “Angry Bird #3 (with grid and graph)” illustrates where I placed the origin more clearly. With the parabola beginning at my origin it gave me an x-intercept of (0,0) and a vertex located at roughly (9.5, 10.5) if I round to the nearest half unit. If I round to the nearest hundredth unit, the coordinates of the vertex are closer to (9.44, 10.56). Note that the precision with which we pick the coordinates for the origin and vertex will affect how well the equation’s graph matches the screenshot. As a result, I am using the more precise measurements. I then plugged my information to into y = a(x – h)^2 + k to get 0 = a(0 – 9.44)^2 + 10.56. Ultimately I found that a ≈ -0.1185004 giving me an equation of y = -0.1185004(x – 9.44)^2 + 10.56.
- Angry Bird #3 (with grid and graph)
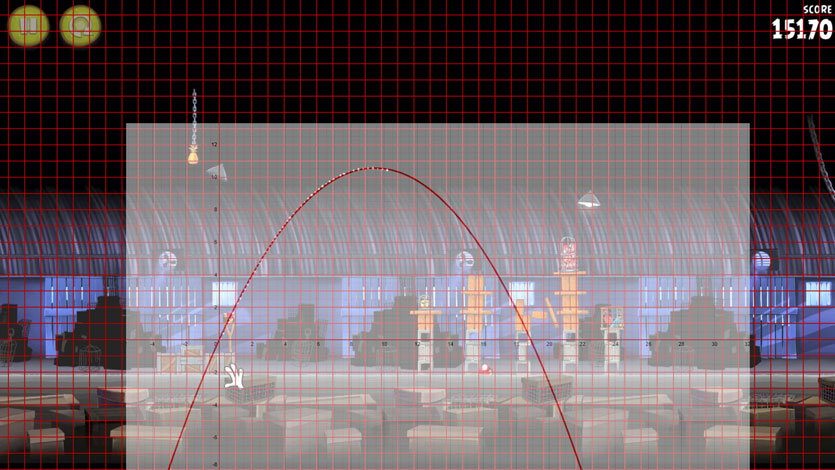
Students need to be reminded at this point that we are still looking for the coordinates of where the Angry Bird would have landed. There are at least two methods for figuring out the location. One would be to graph the parabola for the equation and superimpose that upon the Angry Birds screenshot. I used the Desmos Graphing Calculator website. If students choose that path, I have included what that will look like assuming students picked the origin I picked (refer to the image “Angry Bird #3 (with grid and graph)”). I also included the graph by itself so that students can adjust it to their origin as needed. Using the graphing method, the third bird would land on the ground (note that it is below the x-axis) at about (20.2, -2.2).
- Graph of y = -0.1185004(x – 9.44)^2 + 10.56
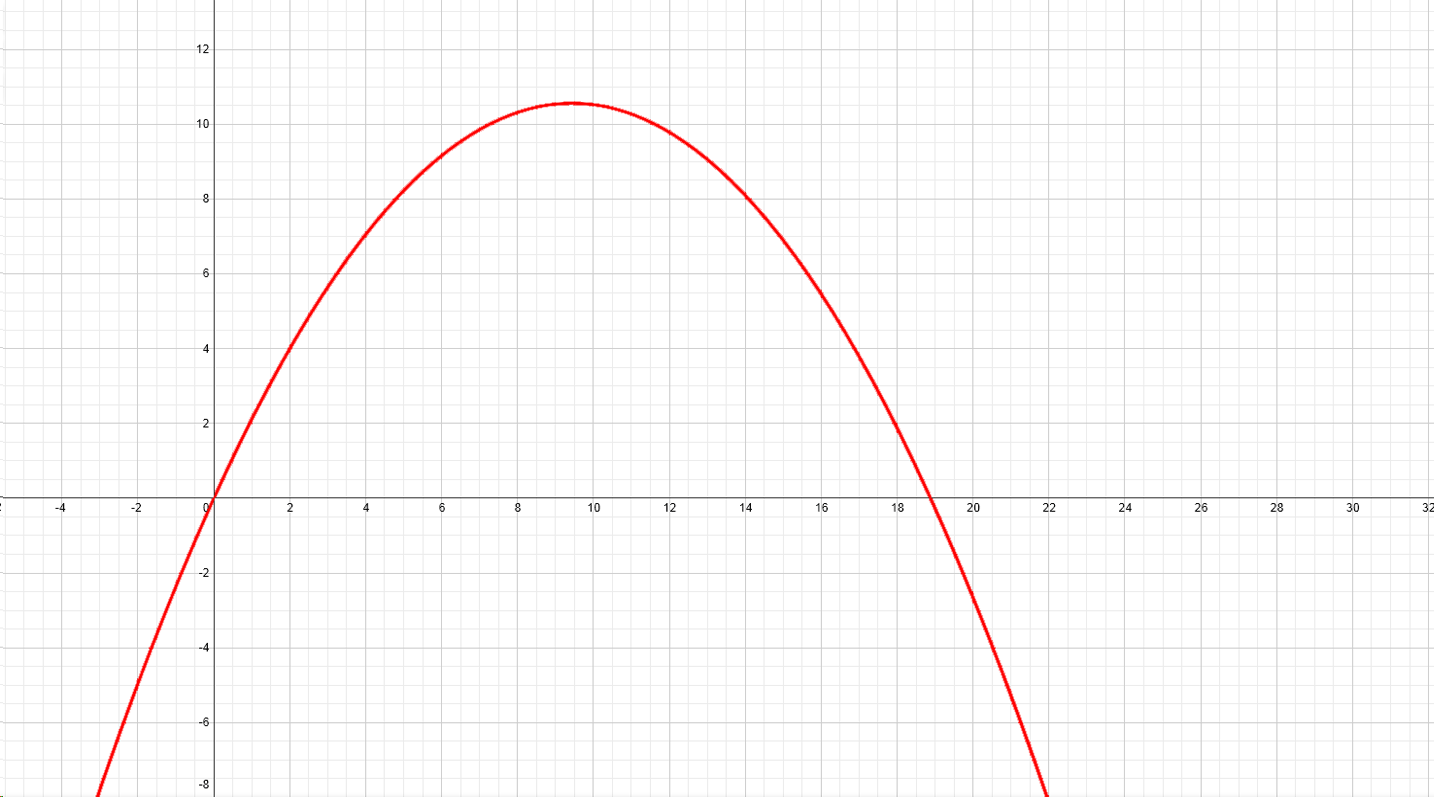
Alternatively students could try to find the location by solving the equation we came up with for when y = -2.2 which is about where it it would hit the ground. Using the solving equation method the third bird would land on the ground at about (19.82, -2.2). The graphing and solving equation answers are not the same and it is worth revisiting the question “What factors may affect your answer’s accuracy?”
- CCSS A-CED.1 Create equations and inequalities in one variable and use them to solve problems. Include equations arising from linear and quadratic functions, and simple rational and exponential functions.
- CCSS F-BF.1 Write a function that describes a relationship between two quantities.
- CCSS F-IF.4 For a function that models a relationship between two quantities, interpret key features of graphs and tables in terms of the quantities, and sketch graphs showing key features given a verbal description of the relationship. Key features include: intercepts; intervals where the function is increasing, decreasing, positive, or negative; relative maximums and minimums; symmetries; end behavior; and periodicity.
- CCSS F-IF.7a Graph linear and quadratic functions and show intercepts, maxima, and minima.
- CCSS F-LE.6 Apply quadratic functions to physical problems, such as the motion of an object under the force of gravity. (California only)


1 Comment