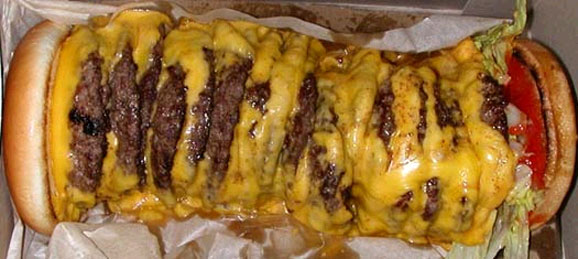

In-N-Out ordinarily sells hamburgers, cheeseburgers, and Double-Doubles (two beef patties and two slices of cheese). While they don’t advertise it, they have a secret menu which includes a burger where you can order as many extra beef patties and cheese slices as you like. The prices and nutrition information are not listed though. The most common orders are 3×3’s (read as “three by three”) and 4 by 4’s (read as “four by four”) that contain three and four layers of beef and cheese, respectively. However some people have ordered 20×20’s (pictured above) and even a 100×100 (pictured below)!

- How much money does a 3×3 cost?
- How many calories is a 3×3?
- How much money does a 20×20 cost?
- How many calories is a 20×20?
- How much money does a 100×100 cost?
- How many calories is a 100×100?
- How much money does a NxN cost?
- How many calories is a NxN?
These questions may be useful in helping students down the problem solving path:
- How would you describe what ingredients are in a 3×3? (To help students realize it is a cheese burger with all the cheese burger toppings plus 2 additional layers of beef patties and cheese)
- How can we figure out how much an additional beef patty and cheese slice cost?
- What are the differences between a cheeseburger and a Double-Double?
- Where do you see the cost of the extra layer mentioned in the words in the table, graph, and symbols?
- Where do you see the cost of the cheeseburger in the words in the table, graph, and symbols?
- How would your answer change if you had started with a Double-Double and added 98 layers versus a Cheeseburger and added 99 layers?
This awesomely gross lesson provides students with a real world context for building linear functions. I recommend beginning with exploring cost before calories because I have included a receipt that shows the actual price of a 100×100 burger. You may choose to begin by asking students about the cost of a 100×100 or start with something smaller like a 3×3. I have found that students with emerging skill sets need to begin with a 3×3 to establish that it is not the same thing as ordering 3 cheeseburgers or a Double-Double and a cheeseburger. Eventually you want them to be able to generalize the cost of a NxN burger.
As much as possible, you want students to do all of the discovery. Make sure to have a conversation about what is on a 100×100. Essentially it is a cheeseburger with 99 additional beef patty and cheese layers or a Double-Double with 98 additional beef patty and cheese layers. There are no additional buns or toppings such as lettuce, tomato, onions, or spread.
We then want to ask students, “How can we figure out how much an additional beef patty and cheese slice cost?” Hopefully they struggle with this question. You may have to ask them, “What are the differences between a cheeseburger and a Double-Double?” We want them to realize that they are the same except for an extra beef patty and cheese slice and a cost difference of $0.90. They can get $0.90 by subtracting the price of a cheeseburger ($1.75) from the price of a Double-Double ($2.65) using the menu below. We want them to make the assumption that perhaps $0.90 is the cost of one layer of beef patty and cheese slice. Note that these prices were from 2004 and were used so they matched the receipt that has the price of the 100×100 on it.


- A picture of a cheeseburger (to establish that it has one cheese slice and one burger patty):

- A picture of a Double-Double (to establish that it has two cheese slices and two burger patties):

- A picture of a 20×20 burger (to establish that it has 20 cheese slices and 20 burger patties):

Below are low, medium, and high work samples for the challenge.
- Low

- Low

- Medium

- Medium

- High

- High

- Here is a Desmos Activity Builder version of this lesson
- Check out Jonathan Newman’s implementation with his students. He included a complete reflection with video of the entire lesson. It is very useful if you plan on using this lesson yourself.
- Mrs. E has a very thorough description of her first venture into problem-based learning using this task. It gives you a great reflection into how the lesson went and her successes and challenges.
- Dan Burfiend shares his two-day implementation of the lesson. Here are his reflections from Day 1 and Day 2.
- Ms. Moore implemented the lesson using multiple representations.
- Shauna Hedgepeth talks about how she uses this task with administrators to provide a context to discuss the Common Core State Standards.
- Tim McCaffrey shares his own take on the problem including an Act 1 video as well as updated prices.
- Dr. Clayton Edwards shows how he facilitated the lesson with his students including the questions he asked.
- Mark James shares how he implemented this lesson using Pear Deck.
- Marc Stegmaier tweeted out how the lesson went with his kids:
In-N-Out problem.. How much would a 100×100 cheeseburger cost? Outstanding job by Algebra 1 students! @innoutburger pic.twitter.com/HD4XZsxxTp
— Marc Stegmaier (@mr_stegmaier) December 4, 2015
- CCSS 8.F.1 Understand that a function is a rule that assigns to each input exactly one output. The graph of a function is the set of ordered pairs consisting of an input and the corresponding output.
- CCSS 8.F.3 Interpret the equation y = mx + b as defining a linear function, whose graph is a straight line; give examples of functions that are not linear. For example, the function A = s2 giving the area of a square as a function of its side length is not linear because its graph contains the points (1,1), (2,4) and (3,9), which are not on a straight line
- CCSS 8.F.4 Construct a function to model a linear relationship between two quantities. Determine the rate of change and initial value of the function from a description of a relationship or from two (x, y) values, including reading these from a table or from a graph. Interpret the rate of change and initial value of a linear function in terms of the situation it models, and in terms of its graph or a table of values.
- CCSS 8.F.5 Describe qualitatively the functional relationship between two quantities by analyzing a graph (e.g., where the function is increasing or decreasing, linear or nonlinear). Sketch a graph that exhibits the qualitative features of a function that has been described verbally.
- CCSS F-IF.4 For a function that models a relationship between two quantities, interpret key features of graphs and tables in terms of the quantities, and sketch graphs showing key features given a verbal description of the relationship. Key features include: intercepts; intervals where the function is increasing, decreasing, positive, or negative; relative maximums and minimums; symmetries; end behavior; and periodicity.★
- CCSS F-IF.5 Relate the domain of a function to its graph and, where applicable, to the quantitative relationship it describes. For example, if the function h(n) gives the number of person-hours it takes to assemble n engines in a factory, then the positive integers would be an appropriate domain for the function.★
- CCSS F-IF.6 Calculate and interpret the average rate of change of a function (presented symbolically or as a table) over a specified interval. Estimate the rate of change from a graph.★
- CCSS F-IF.7 Graph functions expressed symbolically and show key features of the graph, by hand in simple cases and using technology for more complicated cases.★
- CCSS F-IF.7a Graph linear and quadratic functions and show intercepts, maxima, and minima.
- CCSS F-BF.1 Write a function that describes a relationship between two quantities.★
- CCSS F-BF.1a Determine an explicit expression, a recursive process, or steps for calculation from a context.
- CCSS F-LE.1b Recognize situations in which one quantity changes at a constant rate per unit interval relative to another.
- CCSS F-LE.2 Construct linear and exponential functions, including arithmetic and geometric sequences, given a graph, a description of a relationship, or two input-output pairs (include reading these from a table
- CCSS F-LE.5 Interpret the parameters in a linear or exponential function in terms of a context.
- CCSS A-CED.2 Create equations in two or more variables to represent relationships between quantities; graph equations on coordinate axes with labels and scales.
- CCSS A-CED.3 Represent constraints by equations or inequalities, and by systems of equations and/or inequalities, and interpret solutions as viable or nonviable options in a modeling context. For example, represent inequalities describing nutritional and cost constraints on combinations of different foods.
I used this problem to kick off the the school year in a College Prep Algebra (post Alg 2) course. Some of the concepts we were able to mention included what the meaning of the slope and y-intercept were in context, discrete vs. continuous functions, and the different number sets. I think one of the best questions we can ask our students to help them make connections is, “What is a non-example?” or “What is something we can’t do?” For the In N Out problem, I asked “How many patties can we order?” and “What is an example of a number of patties we can’t order?” While finding the price of the 100 x 100 burger is super fun and great to celebrate, I really like all of the connections that we can make when we ask for the price of an n x n burger.
Wow. I really like that question because it gives a context to the conversation about discrete vs. continuous functions and even domain and range. Really nice and I am glad you made this problem your own.
Thanks!
I just came across this lesson as I was scouring the web for a way to both make linear equations both engaging and allow for deep questioning. I love this lesson and plan to use it as a leaping off point for my own lesson. One question though, were students thrown off at all by the naming of burgers as 3×3 and 20×20 and 100×100? I’m thinking that my students that struggle will read that as multiplication (which is clearly silly, but, you know, “kids”…). I was thinking of changing the naming to 3-and-3 and 20-and-20 to avoid this. Have people who have done this with “struggling learners” got any feedback on whether the nomenclature threw them?
Hi Peter. Thanks for checking in. To be clear, “3×3” is spoken as “three by three” and “20×20” is spoken as “twenty by twenty”. I never write 3×3 or 20×20 down (as they are not on the menu and only on the secret menu) so this has never come up and I have never heard of anyone having this problem either. I’ve taught this lesson to all levels of students and it never came up either.
Still such a fun and engaging lesson, although my kiddos wanted to know where they could get a cheeseburger for $1.79! I assured them that the pictures were as old as them. Most Ss had not heard of In-and-Out since many have never left Missouri, but they were ready to go on a field trip. When I showed them the 100 X 100 picture, my 350 lb O-Lineman said, “Now that’s sexy!” I played Buffet’s “Cheeseburger in Paradise” as they entered the room. Great application of our standard of creating eq given two points. Thanks!
Hahaha. Any lesson that involves a “Now that’s sexy!” has to be somewhere on either the very right or very wrong track. Thanks for the laugh.
This promblem involves alot of concepts, plus it is also a good way to do Algebra with real life applications
This was a fun way to extend thinking. I think that students in younger grades can use this problem to add, multiply, and even notice patterns, I like how you build the understanding by starting with a 3 x 3. That teaches students to think about all the details of a problem.
Here’s a follow-up to one of my favorite lessons of all time.
https://www.sfgate.com/food/article/100-burger-in-n-out-22249526.php