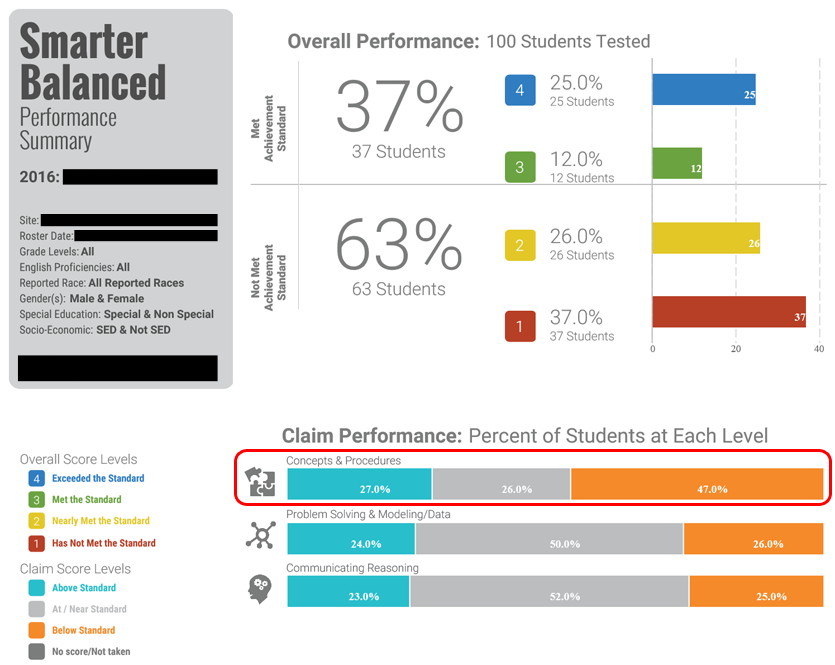
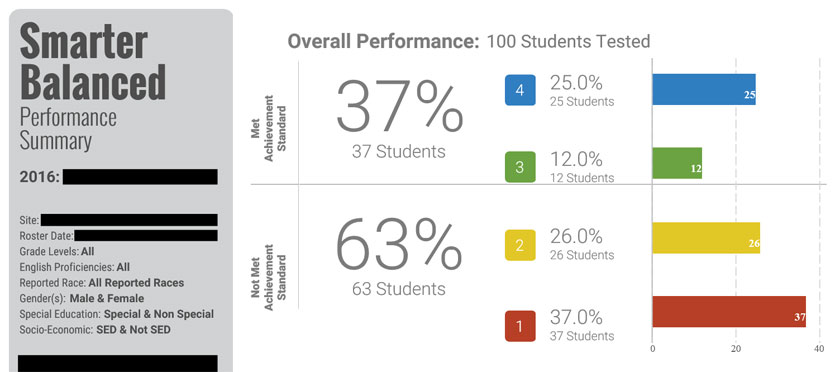
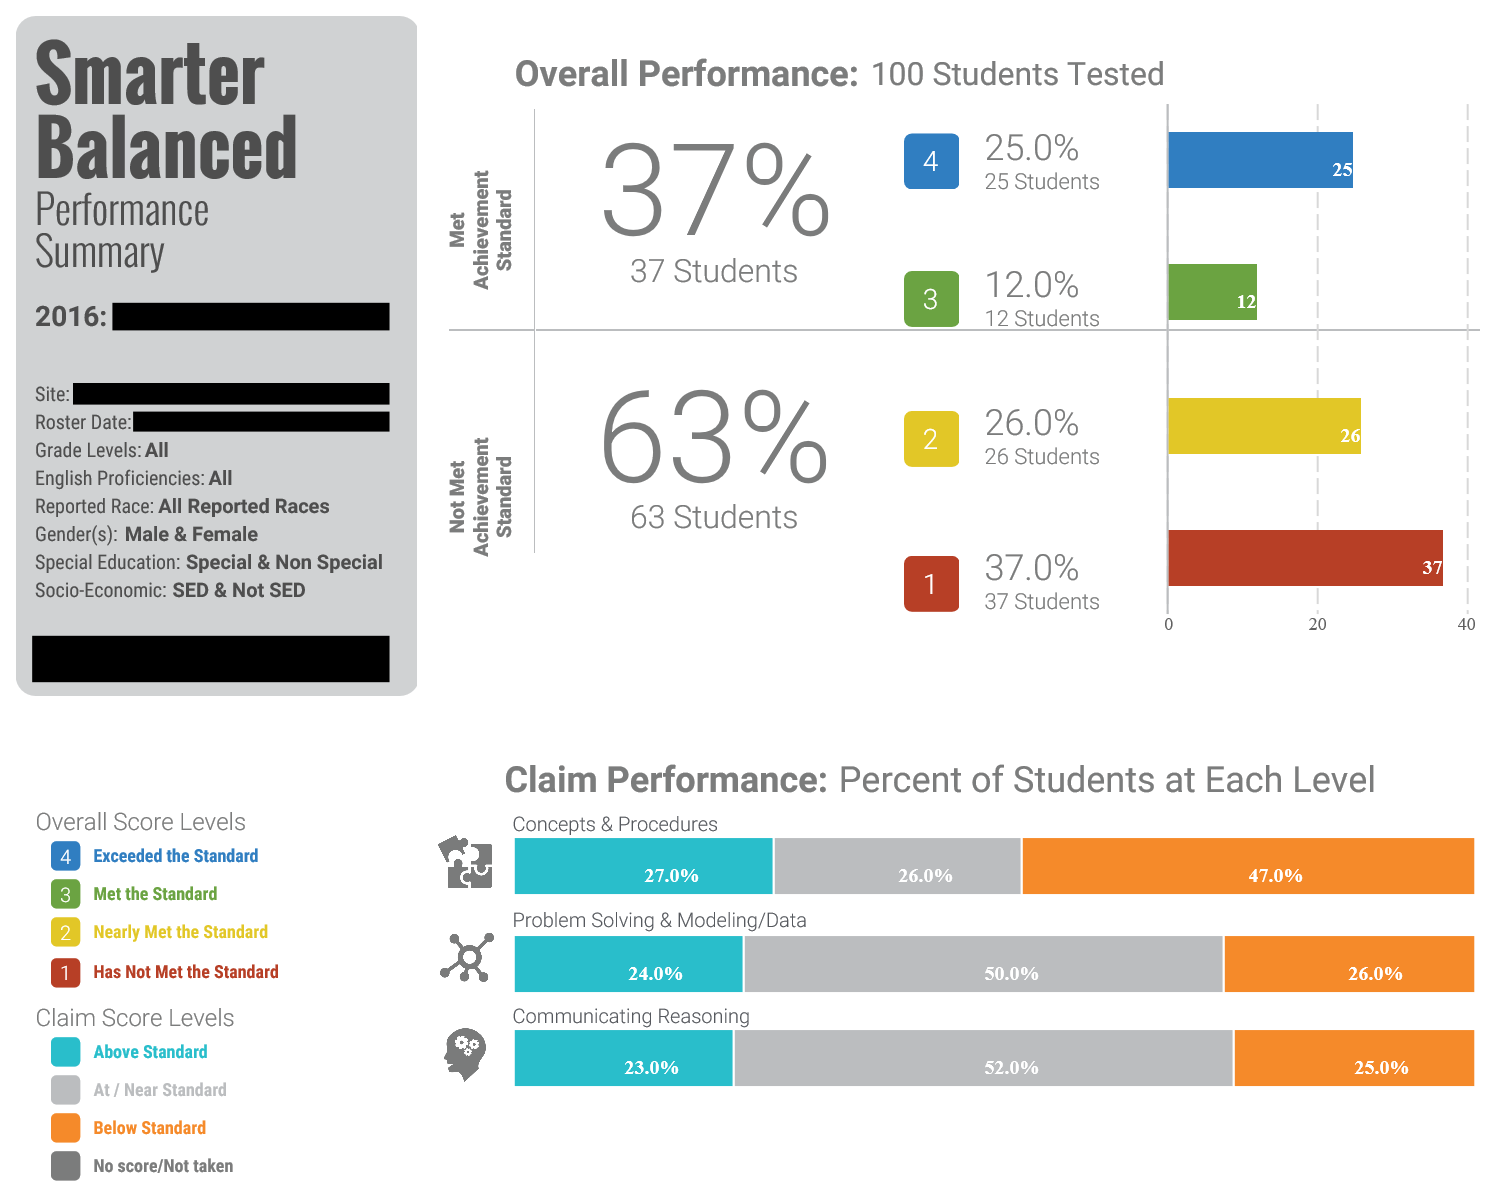
If you live in a state that uses the Smarter Balanced Assessment Consortium (SBAC)’s assessment for the Common Core State Standards in math, then you want to make sure you avoid letting anyone make the score interpretation mistake I describe below. Take a look at the data below that comes from a school’s 2016 scores in mathematics.
While the data may be somewhat informative, it is far from actionable. Specifically, consider the scores for Claim #1: Concepts & Procedures. I’ve taken the picture above and drew a red rounded rectangle around the Claim #1 scores.

You may initially focus on how 27% of students were “Above Standard” (which was more than the other claims) on Claim #1. However, it is also noteworthy that by far more students were “Below Standard” (47%) on Claim #1 than the other claims. This inevitably leads to the question: why?
The most common reason I hear is: “We’ve been spending too much time on rich problems and instead need to spend more time on procedural skill and fluency.” This could very well be true, but that is often the only interpretation that educators consider.
Here are two other potential reasons:
- Perhaps students understood the procedures but did not develop sufficient conceptual understanding.
- Perhaps students worked on both procedural skills and conceptual understanding but it was primarily Depth of Knowledge (DOK) 1 and they were unprepared for DOK 2, 3, and 4.
The reality is that there are multiple potential reasons as to how a claim score was earned and we should be very careful before jumping to a conclusion.
What other SBAC score interpretation issues are you seeing? Please share them in the comments below.


One thing always stands out to me, with this data sample reflective: We so willingly ignore that middle section of students, grouped together as “At or Near Standard”.
If you consider students who classify as “Above, AT, OR NEAR” for the three claims, the argument in favor of rich tasks/problems becomes clear.
Claim 1: Concepts & Procedures – 53%
Claims 2/4: Problem Solving, Modeling & Data Analysis – 74%
Claim 3: Communicating Reasoning – 75%
If you ask many educators, blind, which of these three their students would be weakest in, many would predict Claim 3 since they believe their kids can do the math but not explain their understanding. In fact, this is their STRONGEST, unleveraged skill. They are ADEPT in explaining their thinking and the reasoning of others. This fact is so frequently ignored that they lose the opportunity to LEVERAGE this skill in a deeper understanding and flexibility with those Claim 1 concepts and procedures. Once they have that, not only will Claim 1 rise, but Claims 2, 3, AND 4 should also increase as a result thanks to more detailed accuracy and reasoning.
SBAC data can be frustrating because it does not report to the target level, but the information from the Claims reporting tells us exactly why the kind of math we engage with in classrooms can boost mathematical function.
Thanks Devin. I certainly wish there was more detail provided in the data. I agree with you that they may make assumptions about what the data means, leading to all sorts of suspect conclusions. Let’s hope one day we have more conclusive data.
We dealt with this same issue 2 years ago and after we talked some people off the ledge we added a practice component around skills but did not move away from our commitment to “math with meaning “.
Thanks Ann. It’s certainly challenging trying to derive meaning from the results.
I have an ongoing dialogue with my Principal that we should not be using SBAC or any similar instrument if our goal is to ascertain how far our students have come and how well they are doing. It seems to me that there are other tools available that would help us see a particular student’s strengths and weaknesses. I am working in an elementary school, (grades 1 – 8) and would appreciate any suggestions as to what would be a “good” formative assessment of our students.
Thanks Michele. It sounds like part of the “ongoing dialogue” may include the difference between formative and summative assessments. I like Bob Stake’s quote to distinguish between them: ” When the cook tastes the soup, that’s formative; when the guests taste the soup, that’s summative.”
The SBAC is intended to be a summative assessment. If you are looking for formative assessments, I’d head over to openmiddle.com and try out some of the problems there. You’ll certainly get useful information from using them with students.
Most of us in Vermont who interpret (math coach, data coach, and admins) the SBAC results also wish there was more information offered, so we turn to the IAB’s that are written by the same people, and are short snippets of rigorous questions in distinct domains. We also have rich formative tasks as a tradition here, so sensible discourse is usually encouraged and supports the conceptual development. SBAC has helped to raise the DOK in our curriculums, and thus has teachers and curriculum advisors searching for tasks that will have students using effective calculation in efficient and sensible ways to achieve deeper understanding and confidence in their ability. We go to openmiddle, danmeyer, solveme.edc, whichonedoesn’tbelong, desmos, gregtangmath, and kaplinsky to name a few.
Thanks for sharing this Betty. I’ve yet to see the IAB’s used for something that provided meaningful feedback. This could be due to my lack of understanding and awareness or the possibility that they also don’t give useful feedback.
I’m glad my resources have been amongst those you’ve found helpful.
The CAASPP system now allows a teacher to look at individual student results. I haven’t spent enough time mucking around in the system yet to say how useful it will be, but it is a huge improvement over “oh look, Billy got a green triangle!”
Neat. I haven’t had access to results recently so I hope reporting continues to improve.
I administer the IBA…..mostly to allow my students to see how items are written. We review these questions so students understand what the questions are asking. I believe this data is more valuable, to me as a teacher, than the SBAC data. I spend over two weeks this past summer to try and figure out where I am lacking as a teacher in my curriculum……could NOT find any valuable data I can use as a classroom teacher.
Yeah, it’s super disappointing how hard it is to get actionable data from it.
I have used the IAB’s with various school sites and numerous teachers. The IAB data helps teachers 1) better understand Claim 1 and the level of questioning that students will be exposed to. After all, the only two things that can change are the State Assessment or our classroom instruction. 2) Teachers are better able to determine which Target students need support in and help us create intentional enrichment/intervention groups. 3) Based on the questions that are often missed, we can usually determine what misconception that students are applying that has caused them to arrive at a similar wrong answer. 4) What IAB’s once lacked was Claim 2, 3, and 4 questions. Although the IAB’s are not intended to reflect all four Claims, they now have more than Claim 1 included. Last, timely reflection of the IAB results is critical for impacting instruction. We should talk more.
I have found that the reports are much easier to make sense of and provide an opportunity to reflect and learn when the data is yours. Having the experience of analyzing my own data helped me reflect on the unbalanced approach that I had in the classroom and how it might have impacted my scores. Now that I support and analyze the data of numerous teachers and districts, I often find myself having a reflective conversation with those teachers or teams to discuss what did work, what didn’t we try, and what will we try, moving forward.
My school currently uses IAB’s as a diagnostic and find the data very useful. It allows us to see the problem, how each student answered, the claim, target and error analysis. We have used this information to better target instruction and get closer to filling the gaps that our student have.
Interesting Felicia. I haven’t looked at those in a few years, but when they first came out, they did not appear to give granular enough information to be useful.
The new scores reports became active this year. You can now log in and use the different tabs to get data in a number in ways. The days of getting back triangles, and squares as an indicator are gone.
I so agree with your remarks about these statistics! I become very frustrated when so many labels are placed on our schools from just one set of test data and that data being so vague! Our state does not use SBAC however we do have a very similar platform for our test – I am looking for a software program that provides better diagnostic data and we are currently using IReady- jury still out on this ! Can you point me to any information that tells me how to use Quantile data to make instructional / professional development training decisions ? When I go to conferences and see a presenter with the topic of Quantiles I attend but the information is very shallow.
I honestly do not have much expertise with using quantile data to make decisions. Sorry! If you find anything actionable, please leave another comment.
I think there is another explanation for the scores in general and that is failure to understand the Common Core vertical progression. For example, we used to teach the same skills in multiple grades, with each grade adding either more procedures or steps to the algorithms. In Common Core fraction skills are taught across multiple grades (3-6), but each of those grade levels have their own specific skills. Given the pick and choose mentality that permeates our teaching system, many teachers do not give priority to teaching THEIR piece of the puzzle, which leads to partial understanding of skills that have to be MASTERED before they can be successful in the following grades. Here is a graphic that will point this out, IMHO!
https://www.edweek.org/ew/collections/common-core-math-report-2014/fractions-by-grade-level.html
This is a great addition to the blog post. Yes, understanding that only part of a topic has been taught so far is definitely a part of the bigger picture.
My comment is not directly connected to SBAC, but it definitely relates. I worked with 29 districts for 12 years at a local cooperative in our state. At that time we were able to do an item analysis of our state test. The first step I always asked them to do was to make predictions. The number one prediction teachers would make was, “if the problem involved a lot of reading the students would score poorly.” This was NEVER the case. The more we would dig into DOK levels as well as students conceptual vs procedural understanding, the more we would discover that this was actually the issue. This was usually very eye opening for most teachers and really helped them analyze their instruction. I think our belief systems play such a big role in how we interpret data regardless of what the data may actually be revealing. We need to find ways to dig deeper with any data we have.
Love this. Making a prediction gets them invested and then makes them more likely to want to uncover why they were right OR wrong. Well done.
California addresses this in the new updated framework chapter 12. https://www.cde.ca.gov/ci/ma/cf/
High Stakes assessments are so far removed from the direct impact and action taken towards authentic learning in the classroom, by design. We should be focusing on environments where exploring mathematics and allowing students to develop deeper understanding collectively to solve relevant problems takes center stage. Mathematics programs should be developed and designed for more equity, access, using a universal design approach, and the assessment system should reflect those changes instead of being a barrier or label students are assigned.