- How many years will it take from saved gas money to pay for the extra cost for a hybrid?
- Could you ever save enough money on gas (compared to your current car) to pay the entire car payment?
- How many miles will the car be driven each year?
- What is the car’s miles per gallon (mpg)?
- What does a gallon of gas cost?
Exploring the answer:
- What is being measured on the axis?
- What do the y-intercepts mean?
- What is the significance of where the two lines intersect?
- What does it mean when one line has higher y-values than the other line?
Students should begin this problem by focusing on what information they will need. The list of information they will need to know includes:
- The price of the cars
- The distance (in miles) the cars are driven
- The miles per gallon (mpg) each car gets
- The cost of gas
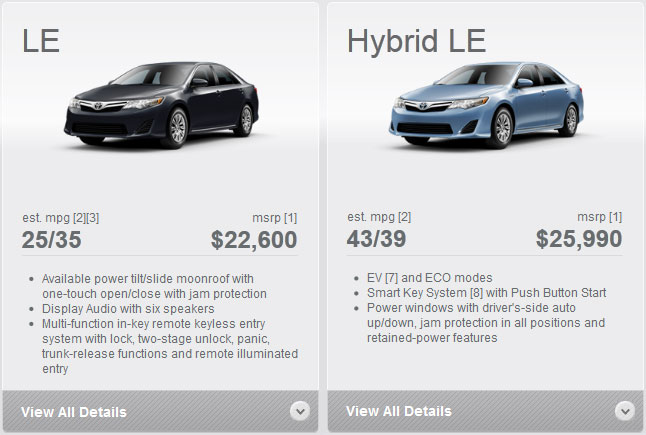
For the price of the cars, I have provided two options. Both options ignore extra fees such as registration and tax. If you want to keep it simple, the image “Toyota Camry LE vs. Toyota Camry Hybrid LE MPG” (from the Toyota website) has the MSRP listed and students can use that.
- Toyota Camry LE vs. Toyota Camry Hybrid LE MPG
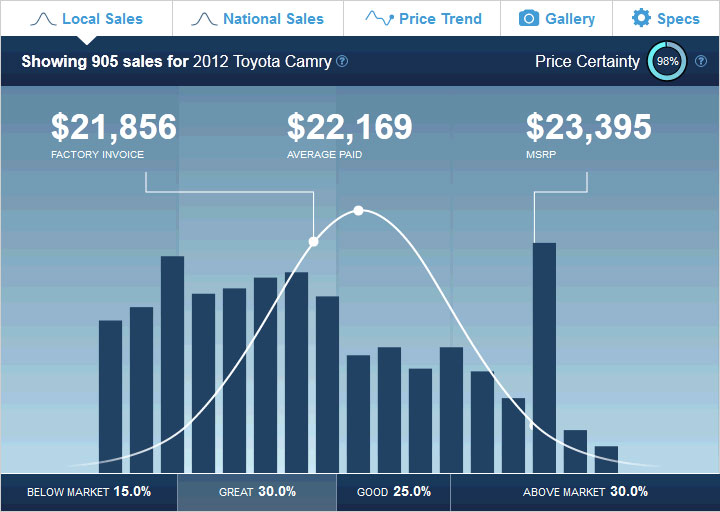
In reality, most people pay something below MSRP and I have provided “Sales Data” (from TRUECar.com) for both cars.
- Toyota Camry LE Sales Data
- Toyota Camry Hybrid LE Sales Data
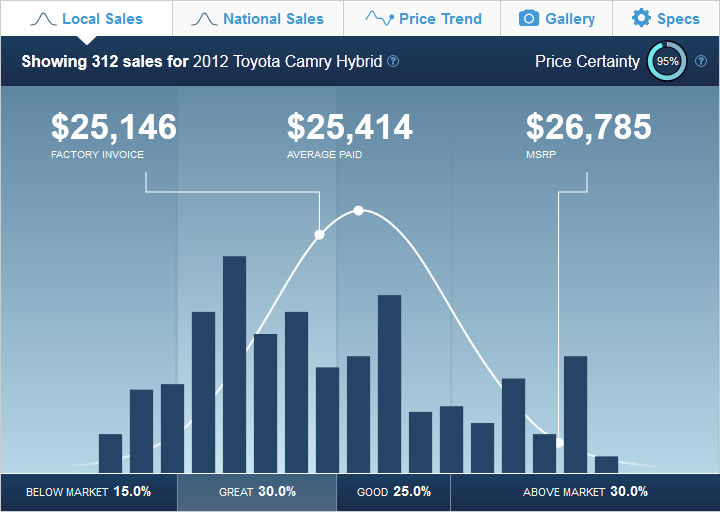
FYI, I am not sure why the MSRP on the “Sales Data” images are different from what Toyota lists on their website. Students may want to use the “AVERAGE PAID” amount instead. I have used the MSRP in my solution.
For systems of equations, the cars’ prices will be the y-intercepts ($22,600 and $25,990). For rates, students can just subtract the two prices to find out how much money needs to be saved to break even ($2,600 – $25,990 = $3,390).
Next students will need to find out each car’s yearly gas costs. Many assumptions will need to be made here and should be agreed upon as a class:
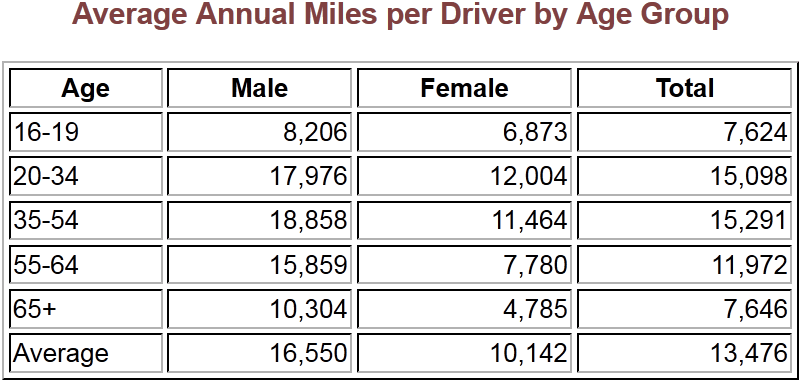
- How many miles will the car be driven each year? – Your class should use the chart below (from the US Department of Transportation – Federal Highway Administration) to agree upon a common value. I used the bottom right cell of 13,476 miles which was the average of all the ages and genders.
- What is the car’s miles per gallon (mpg)? – Miles per gallon with separate values for city and highway driving is above in the image “Toyota Camry LE vs. Toyota Camry Hybrid LE MPG”. Your students should agree upon a common value by first determining what portion of the time the car will be driven in the city or highway. For example, if it is 50% city and 50% highway, then 25/35 will give an assumed value of 30 mpg (.5 * 25 + .5 * 35). If it is 75% city and 25% highway it would be 27.5 mpg (.75 * 25 + .25 * 35). I will test both 50/50 and 75/25. NOTE: Students may not know how to read mpg listed as 25/35 (as some think it is a fraction). You may need to clarify for them that it is listed as City mpg / Highway mpg. Also, hybrids have a higher city mpg because they switch to electricity more often in the city.
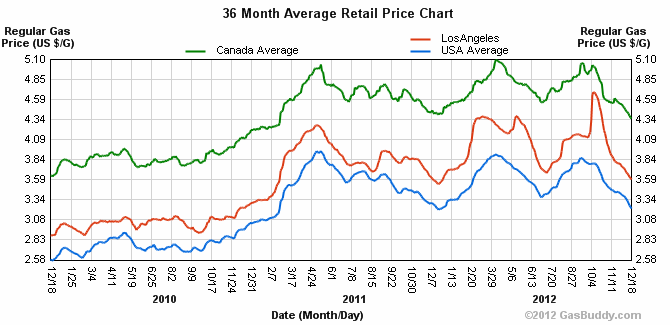
- What does a gallon of gas cost? – This can be as simple as going to the nearest gas station and finding out what they are currently selling a gallon of regular gas for. Just in case, I have provided the 2010-2012 Average Retail Price Chart for One Gallon of Regular Gas in Los Angeles, USA, and Canada. I will test both $4 per gallon and $5 per gallon as gas prices might rise. Obviously any value could be tested.
- Assumptions that may not need to be mentioned but can be addressed as they come up include:
- Both cars use regular unleaded gas.
- Both cars have equal maintenance costs (which may not be true)
The solution to this problem will vary based on the assumptions. In all scenarios I assumed that 13,476 miles were driven each year (the average number of miles driven of all ages and genders) and I wanted to test out both a balanced highway / city model as well as a heavy city driving model.
I then determined the car’s average mpg by testing out two scenarios: 50% city driving and 50% highway driving (30 mpg for LE and 41 mpg for Hybrid LE) as well as 75% city driving and 25% highway driving (27.5 mpg for LE and 42 mpg for Hybrid LE). I then divided the 13,476 miles by the mpg to find the number of gallons the car would use in a year. Taking that number of gallons times the cost of a gallon of gas gave me the yearly gas cost. For gas I wanted to test out two gas prices: $4 a gallon and $5 a gallon.
This resulted in the following four solutions:
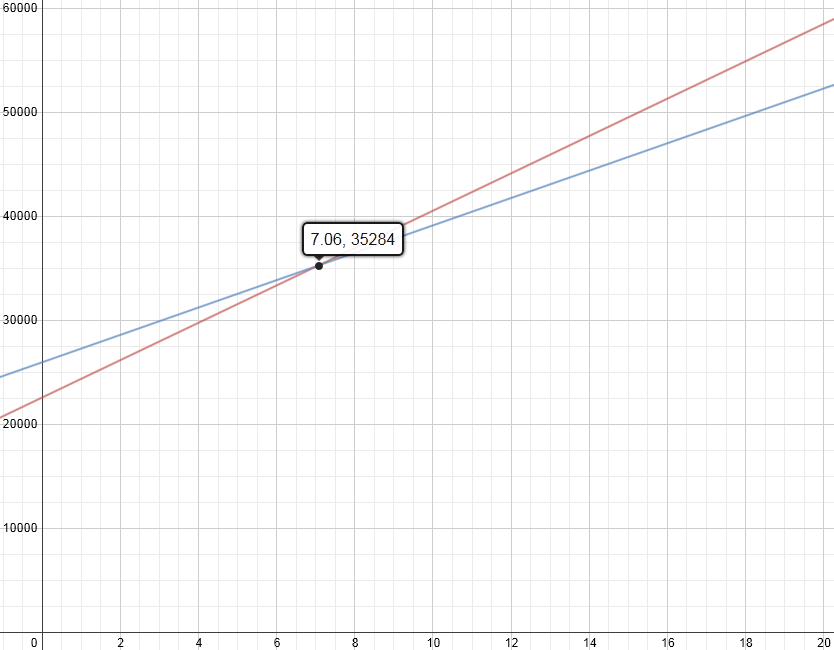
- Option 1: ~7 years, 1 month ($4 per gallon with 50% city driving and 50% highway driving)
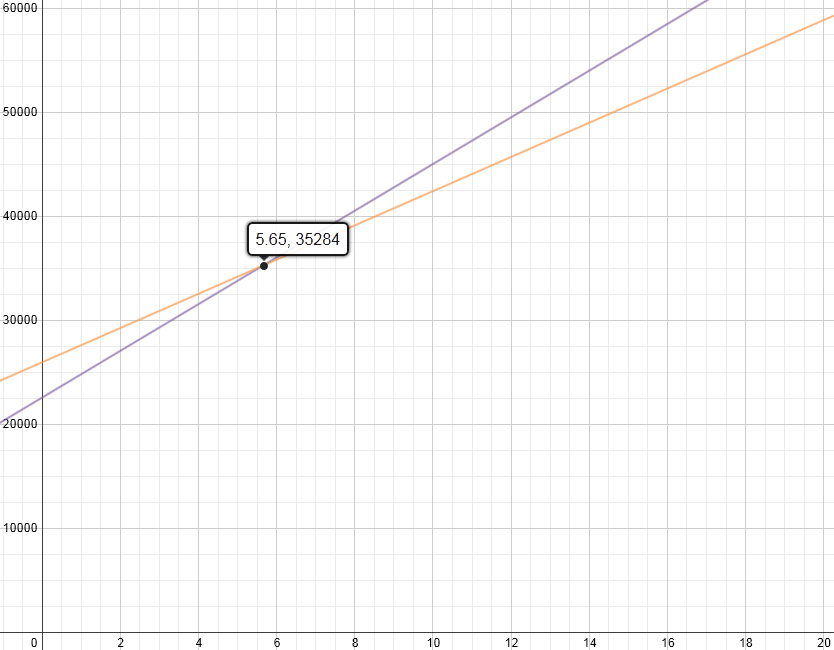
- Option 2: ~5 years, 8 months ($5 per gallon with 50% city driving and 50% highway driving)
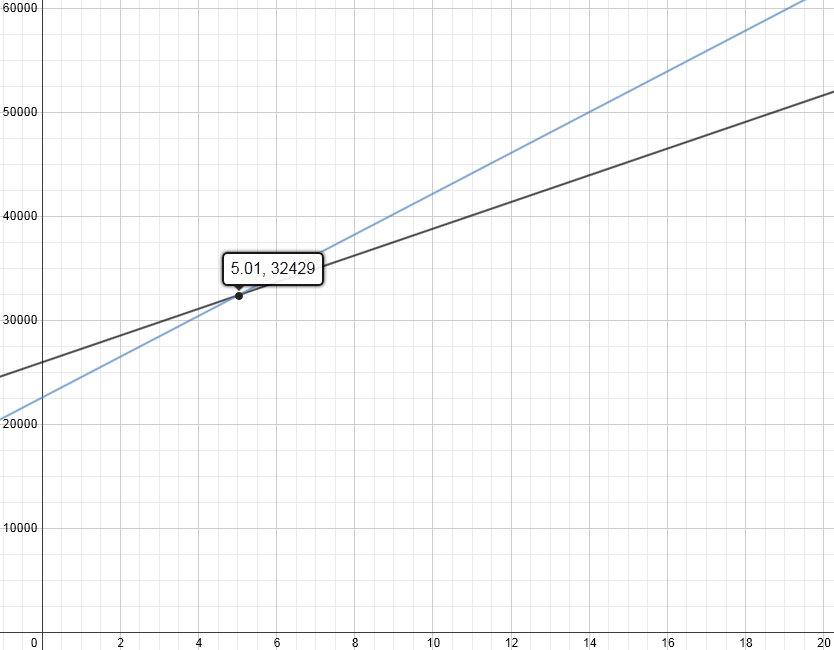
- Option 3: ~5 years ($4 per gallon with 75% city driving and 25% highway driving)
- Option 4: ~4 years ($5 per gallon with 75% city driving and 25% highway driving)
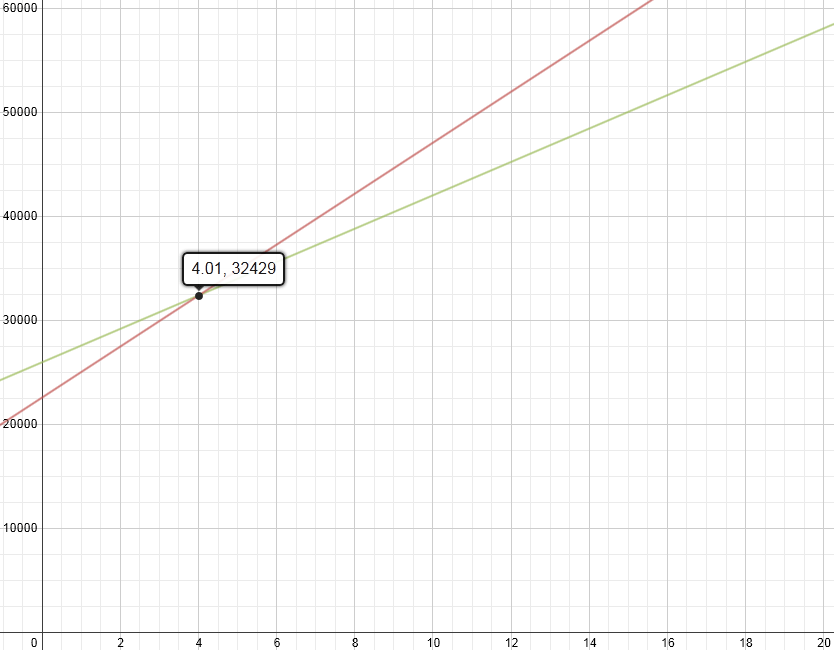
No matter what assumptions are made, there is rich context here to have discussions around. What is being measured on the axis? What do the y-intercepts mean? What is the significance of where the two lines intersect? What does it mean when one line has higher y-values than the other line?
If only rates are being used and not systems of equations, the question is tweaked slightly so students focus on when you will have saved enough to earn back the difference in car prices of $3,390. There are many ways to determine this, but one way is to have students find the annual gas costs for each car and subtract them. For example, in the 50% city / 50% highway at $4 per gallon scenario, the Camry LE spends $1,796 per year in gas while the Camry Hybrid LE spends $1,316 per year in gas. So, the Camry Hybrid LE saves $480 ($1,796 – $1,316) per year. Accordingly, $3,390 divided by $480 is 7.06 years or 7 years, 1 month.
- CCSS 6.RP.2 – Understand the concept of a unit rate a/b associated with a ratio a:b with b ≠ 0, and use rate language in the context of a ratio relationship. For example, “This recipe has a ratio of 3 cups of flour to 4 cups of sugar, so there is 3/4 cup of flour for each cup of sugar.” “We paid $75 for 15 hamburgers, which is a rate of $5 per hamburger.”
- CCSS 6.RP.3 – Use ratio and rate reasoning to solve real-world and mathematical problems, e.g., by reasoning about tables of equivalent ratios, tape diagrams, double number line diagrams, or equations.
- CCSS 8.EE.8c Solve real-world and mathematical problems leading to two linear equations in two variables. For example, given coordinates for two pairs of points, determine whether the line through the first pair of points intersects the line through the second pair.
- CCSS A-CED.3 Represent constraints by equations or inequalities, and by systems of equations and/or inequalities, and interpret solutions as viable or nonviable options in a modeling context. For example, represent inequalities describing nutritional and cost constraints on combinations of different foods.
- CCSS F-BF.1 – Write a function that describes a relationship between two quantities.
- CCSS F-LE.5 – Interpret the parameters in a linear or exponential function in terms of a context.
- TRUECar (Toyota Camry LE)
- TRUECar (Toyota Camry Hybrid LE)
- GasBuddy Average Retail Gas Price Chart
- Toyota
- US Department of Transportation – Federal Highway Administration
- Consumer Reports
- Desmos Graphing Calculator



You can have the students research different automobiles, not just the Camry. As other cars, do not have as close of a price gap. Try an SUV, those are very funny to see. They can also use this website http://gasprices.aaa.com/ to use the current average from their own state. There are a lot of fun ways to find the break-even point. I have been doing this project for years with my Consumer Math class.
Thanks Brett! These are all great resources to keep in mind. Much appreciated.
Dear, Robert do any problems that are open ended like this one for fourth grade? My student love the Which one doesn’t belong problems. I want them to be able to explain why they haven chosen that answer. Then using a program called ” Flipgrid” other students can respond to the original post explaining why they agree or disagree. Thank you.
Hmm. Not sure if I have anything quite like that. Have you looked through my lessons page? There are some that could work. https://robertkaplinsky.com/lessons/
I’ve had electric for 3 years. ‘0’ dollars spent on maintenance. Driving for 3 years on 13K miles per year would add up nearly 40K miles. That alone is ‘8’ oil changes/maintenance visits to dealer which add up pretty quickly. Not one visit to dealership for electric car. Actually I was provided with 4 free visits for incidental stuff for first 3 years. (top off water; tire rotations; check up). Once again. ‘0’ expenditures.
Thanks Carlos. We actually just went all electric in my family and am looking forward to similar savings.
It would also be good to have them to calculate the true difference in the price of the vehichles by having them calculate and include the amount of interest paid. This will also serve as a review of simple and compund interest.
Sure. Many extensions are possible.
I love the lesson! How long does it take to teach the lesson?
It really depends. It can take as long as you want. Typically I’ve done this in one to two 50-minute periods.
I love your work. Thank you Robert.
Thanks Roberto.