

- What was Anssi Vanjoki’s annual income?
- How much would the traffic ticket be if you received the same speeding ticket and made €60,000 a year?
- What information will we need?
- What assumptions will we have to make?
- Why is the answer from our formula different from the answer on the Ticket Calculator?
- Severity of the violation
- Monthly income
- Number of dependents
For this activity, I suggest eliminating two of the variables by having students assume that they have no dependents and picking “Speeding 25 km/h, speed limit over 60 km/h” (which was what Anssi Vanjoki was charged with) as the traffic violation. That will leave only one variable (monthly income) to solve for. Note that it is monthly and not yearly income so be on the lookout for errors caused by using annual income instead of monthly income or vice-versa.
Begin the problem by reading an excerpt from a 2001 Wall Street Journal article (included in the “Download files” link). It has the information students need to create the formula. Note that I have changed one of the values as fines used to be reduced by 1500 Finnish Marks but now they are reduced by 255 Euros. I also removed the sentences about the dependents. That leaves:
“Using an overhead projector back at the Interior Ministry, Mr. Wuoma attempts to explain the math. He takes out a piece of paper covered with long equations, which seem more appropriate for a college class in nuclear physics.
The equations start with a motorist’s net monthly income. The figure comes into play whenever a driver is caught going at least 12 miles an hour over the posted limit (below that, the fine is a fixed amount, ranging from $63 to $110). To begin, the driver’s monthly net income is reduced by 255 Euros ($235) and that total is divided by 60. This figure is supposed to represent a person’s daily disposable income.
…
[That] figure, called a day fine, is then multiplied by a number ranging between one and 120, representing the severity of the violation as determined by the traffic officer. For example, a person driving 20 miles an hour over the limit on a highway in good weather might be assessed 12 day fines.”
Using this information, you can get the rough formula of:
Money owed = Daily disposable income * severity of violation
Breaking it down further you get:
Money owed = ((Motorist’s net monthly income – 255) / 60) * severity of violation
If we assume that we are dealing with “Speeding 25 km/h, speed limit over 60 km/h” as described in the story (12 day fines) we get:
Money owed = ((Motorist’s net monthly income – 255) / 60) * 12
or
y = 12((x – 255)/60)
where y represents the money owed and x represents the motorist’s net monthly income.
Something to note is that while the excerpt does not mention it, the actual formula gets rounded twice during the calculations. First, the value of the “daily disposable income” is rounded down to the nearest whole number before it is multiplied by the severity of the violation. Second, the final answer is rounded to the nearest whole number. As such, answers from the linear equation will be off by a small amount due to no rounding. This will show up later in the graph.
Students will be able to verify their answers (or at least check if they are close) by using the Finland’s police website that has an English language “Ticket Calculator” where students will be able to plug in values to verify that their answer is correct.
Another interesting aspect about this problem is that the code that Finland’s police use to calculate the ticket is viewable. I have included a slightly modified portion of it below.

It is written in JavaScript but it is still readable in terms of the math. The first part says that the number of dependents comes from the number entered on the form. The portion that says “Math.floor” means to round down to the nearest integer. The portion that says “if (fineSize < 6)” means that if the person makes so little money that their daily disposable income is less than €6, make it equal to €6 anyway. The last part says that the total fine should be the daily disposable income * severity of violation, rounded to the nearest Euro.
Additionally, I took the resulting equation and plugged two versions of it into Desmos Graphing Calculator. One version is y = 12((x – 255)/60) which we came up with above. The other is a version that includes the rounding and makes a very nice step function. You can click on the link to play around with the equations or view a portion below.
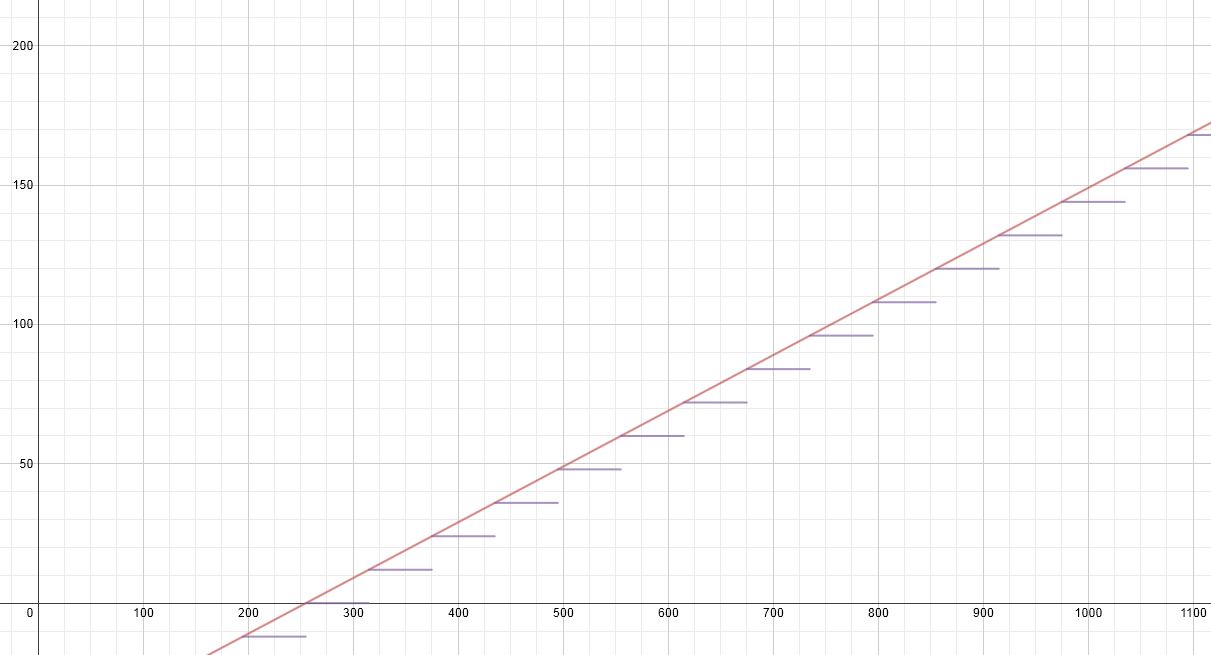
Something to be aware of is that graph does not show that the minimum speeding fine is €115.
Finally, the answer to the questions:
“Vanjoki is a senior executive of Nokia, the world’s largest cell phone maker, and his fine was assessed on a 1999 income of $5.2 million.” Students will likely have an answer in the $4 to 6 million dollar range. The difference may be caused by a change in the formula since the fine was issued (from Marks to Euros) as well as exchange rate conversions made when the article was written in 2002 (from Marks to Dollars).
The answer to the second question is €948 (using rounding) or €949 (without rounding) because 12((5000 – 255)/60) = 949.
- CCSS A-CED.2 Create equations in two or more variables to represent relationships between quantities; graph equations on coordinate axes with labels and scales.
- CCSS F-BF.1 Write a function that describes a relationship between two quantities.
- CCSS F-IF.4 For a function that models a relationship between two quantities, interpret key features of graphs and tables in terms of the quantities, and sketch graphs showing key features given a verbal description of the relationship. Key features include: intercepts; intervals where the function is increasing, decreasing, positive, or negative; relative maximums and minimums; symmetries; end behavior; and periodicity.
- CCSS F-IF.6 Calculate and interpret the average rate of change of a function (presented symbolically or as a table) over a specified interval. Estimate the rate of change from a graph.
- Finland’s Ticket Calculator
- Wall Street Journal Article reprint
- Desmos Graphing Calculator