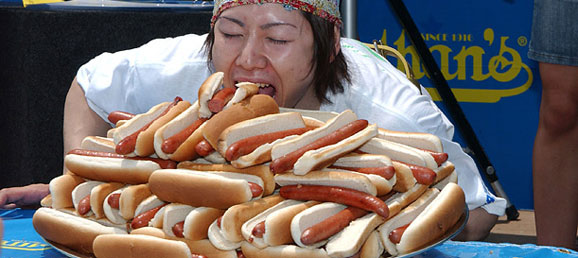

What if the convenience store did not run out of hot dogs for rival competitive eaters Takeru Kobayashi and Sonya “Black Widow” Thomas to eat?
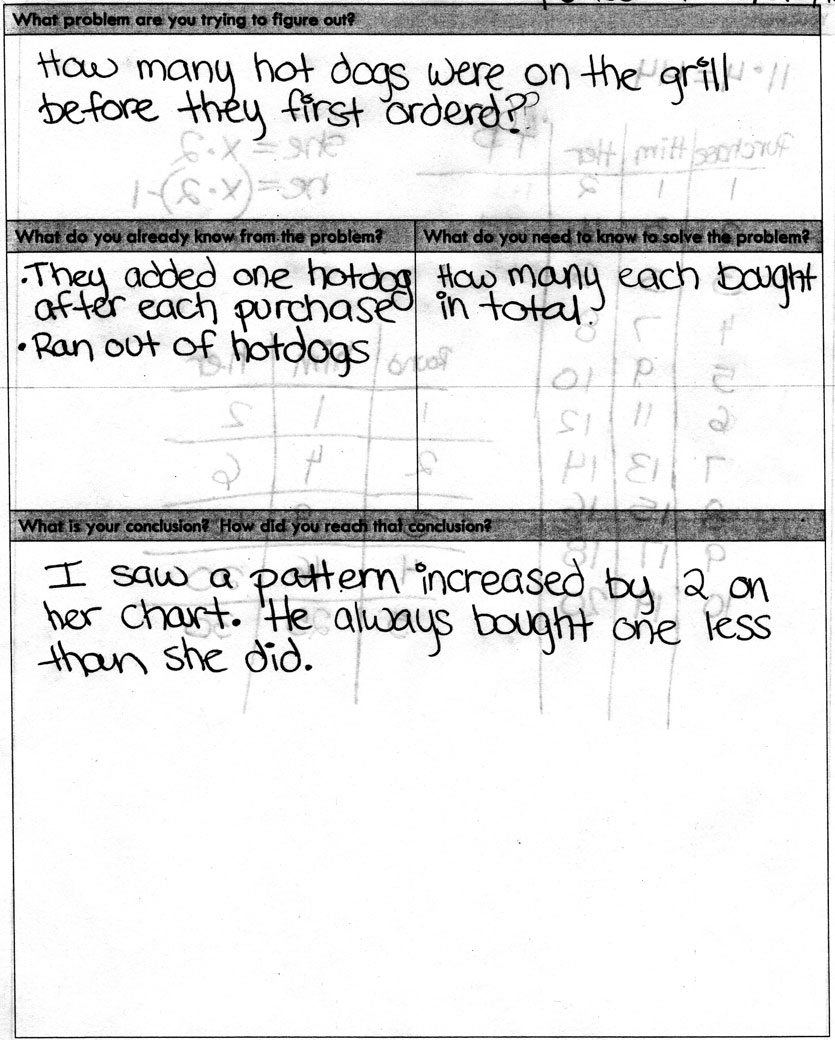
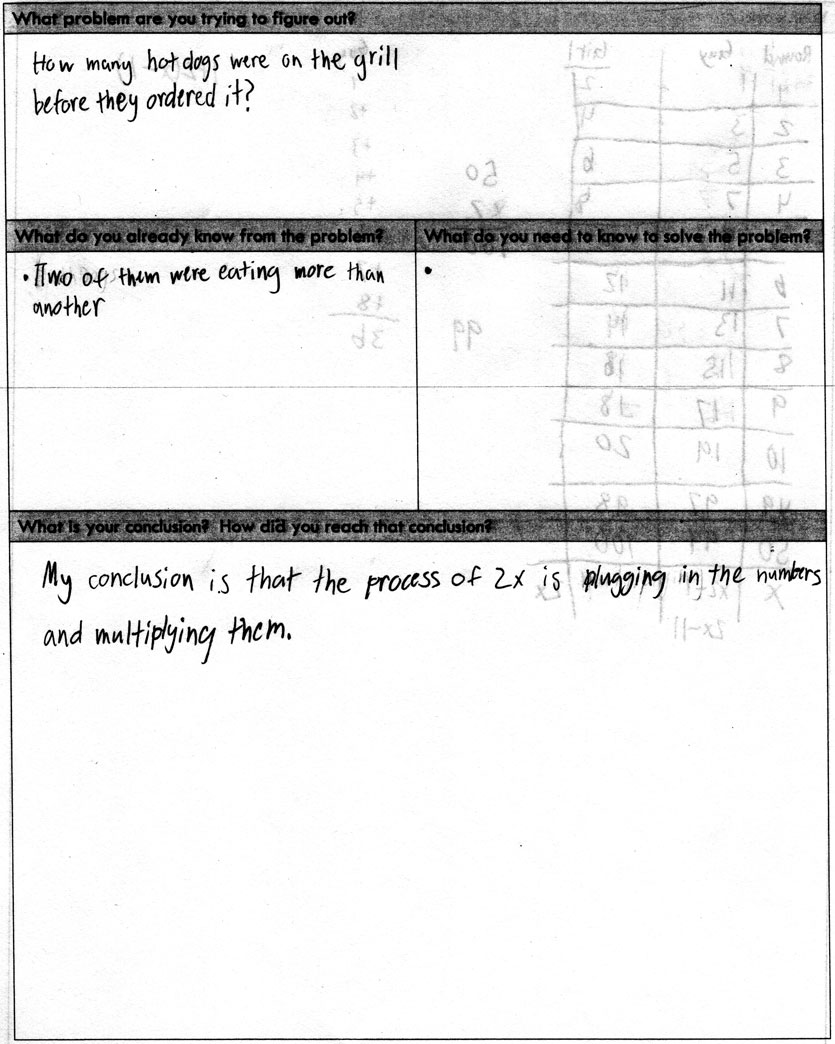
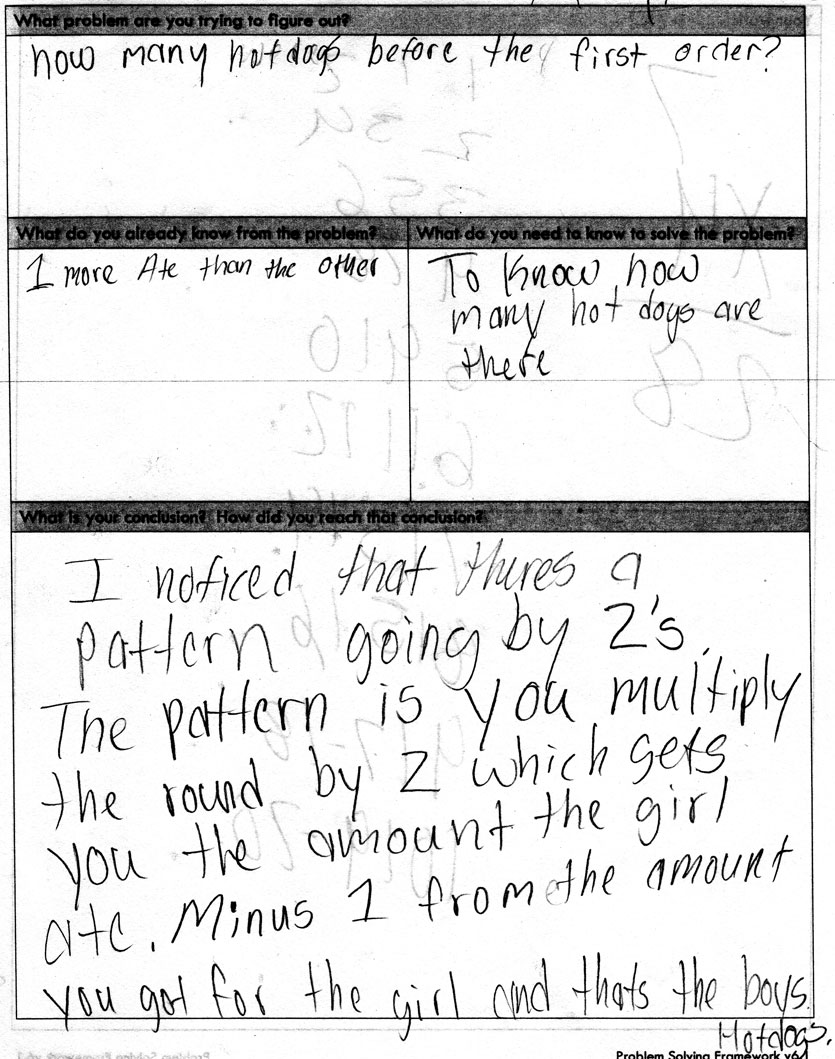
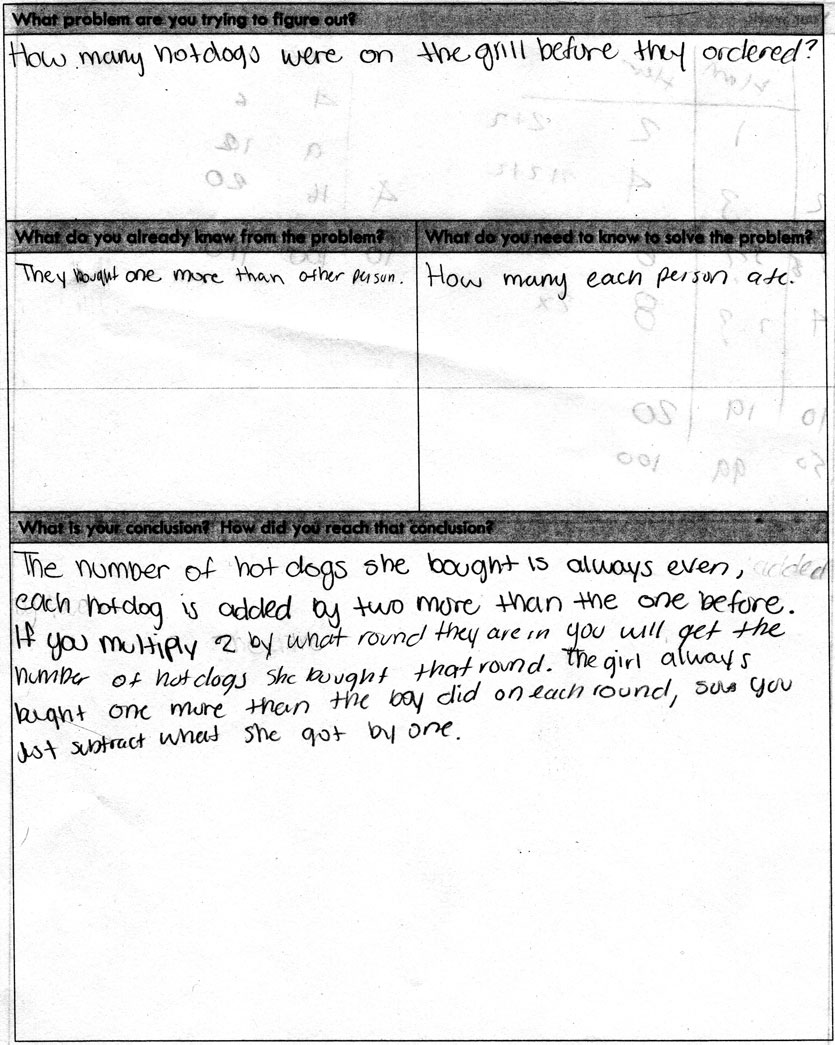
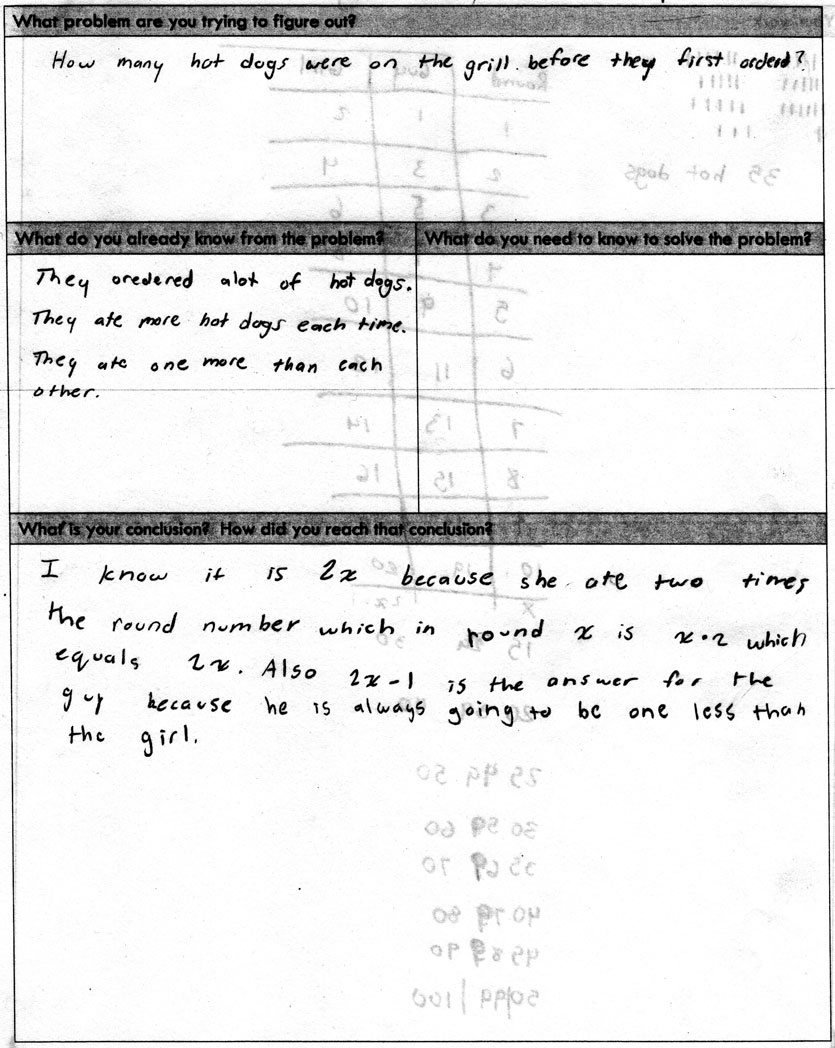
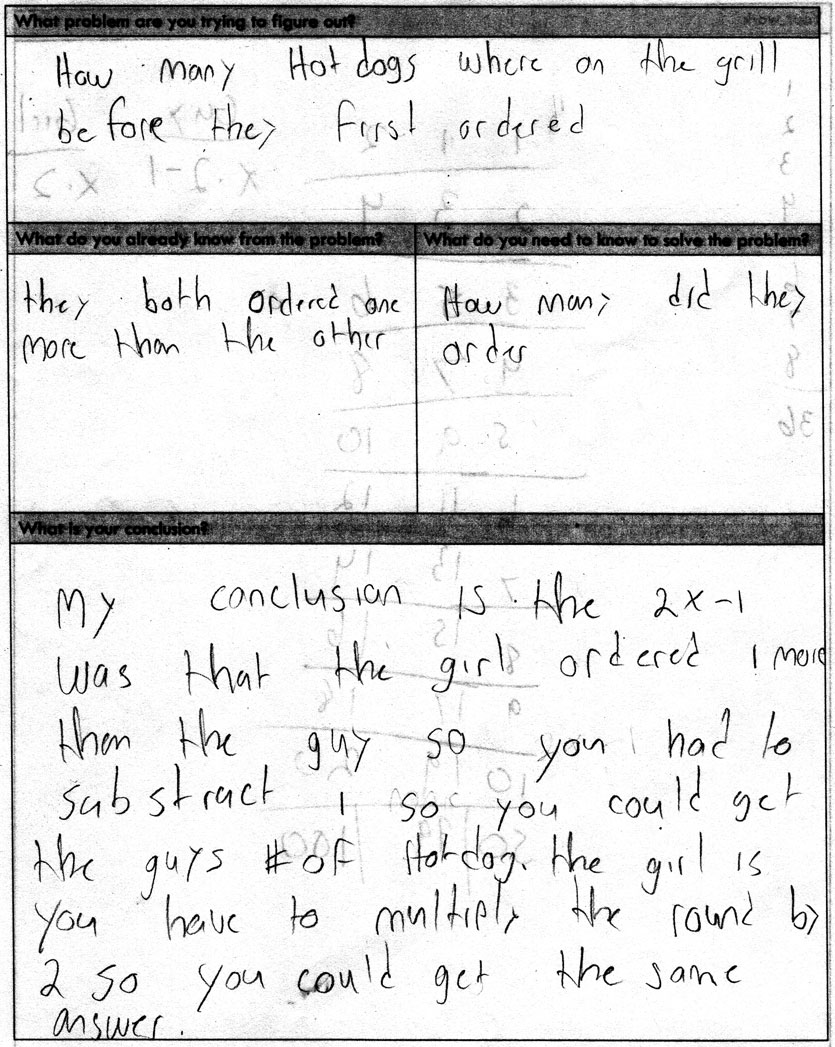
- How many hot dogs were on the grill before Kobayashi ordered the first hot dog?
- How many hot dogs would each person eat in Round 20?
- How many hot dogs would each person eat in Round n?
- How many total hot dogs would each person have eaten in Round 20?
- How many total hot dogs would each person have eaten in Round n?
- How many hot dogs would Kobayashi have to eat to catch up to Sonya after Round 20 is over?
- How many hot dogs would Kobayashi have to eat to catch up to Sonya after Round n is over?
These questions may be useful in helping students down the problem solving path:
- What is a guess that is too low?
- What is a guess that is too high?
- What is your best guess?
- How many hot dogs did each person order each round?
- What pattern do you see?
- How can we record this information?
- How many total hot dogs did each person eat in the first four rounds?
I define each “round” as each of them getting to order hot dog(s). So in Round 1, Kobayashi eats one hot dog and Sonya eats two hot dogs. In Round 2, Kobayashi eats three additional hot dog and Sonya eats four additional hot dogs. This continues until Kobayashi tries to order nine hot dogs to begin Round 5 and finds that the store has run out.
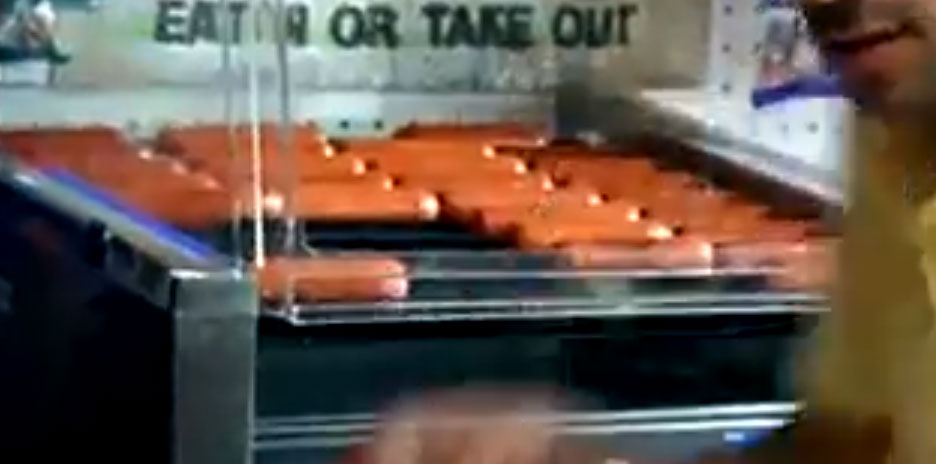
The purpose of the first question is to give students a question that they can sink their teeth into. There are many ways for them to determine that together the pair ate 36 hot dogs in the first four rounds (1 + 2 + … + 8). If you stop the video at 0:12, you can sort of count the hot dogs. I can clearly see four columns with at least eight hot dogs per column. For the sake of this problem, I am going to pretend that they each have exactly nine hot dogs in each of the four columns. The screen shots below help make this clearer:

Depending on the challenge questions you ask, this problem will require only linear models (#2 and #3) or also quadratic models (#4 – #7). I picked Round 20 and Round n, but feel free to modify this and add an earlier round like Round 10 if students need more scaffolding.
In case questions 6 and 7 are unclear, what I mean is that Kobayashi starts to fall behind Sonya at the end of the first round because she orders one more than him. This continues and he falls farther behind her. So, how many hot dogs would he have to eat to catch up to her?
The table below under has the answers to all the questions.
- Excel spreadsheet table
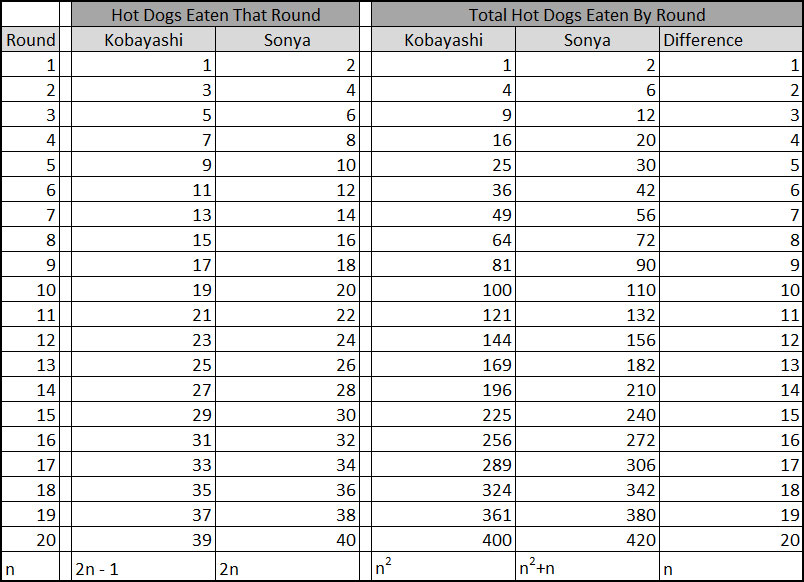
Something important to note is that there are many ways to get the answers. For example, with question 7, one student might notice that Kobayashi eats one less hot dog each round and so after n rounds, he has to eat n hot dogs to catch up. Another students might reason that after n rounds, Kobayashi has eaten n^2 hot dogs and Sonya has eaten n^2+n hot dogs. Subtraction the n^2 from n^2+n leaves just n, which is how many hot dogs behind he is. Those are two different approaches that give the same answer, and it would make for a great discussion as to how that happened.
- Valerie Barsevich shares how she implemented this problem with her students.
- Low (No answer stated and partial but insufficient reasoning)
- Low (No answer stated and partial but insufficient reasoning)
- Medium (No answer stated but sufficient reasoning)
- Medium (No answer stated but sufficient reasoning)
- High (Correct answer and sufficient reasoning)
- High (Slight mistake with answer but reasoning supports that it is a careless mistake)
- CCSS 8.F.3 Interpret the equation y = mx + b as defining a linear function, whose graph is a straight line; give examples of functions that are not linear. For example, the function A = s2 giving the area of a square as a function of its side length is not linear because its graph contains the points (1,1), (2,4) and (3,9), which are not on a straight line.
- CCSS 8.F.4 Construct a function to model a linear relationship between two quantities. Determine the rate of change and initial value of the function from a description of a relationship or from two (x, y) values, including reading these from a table or from a graph. Interpret the rate of change and initial value of a linear function in terms of the situation it models, and in terms of its graph or a table of values.
- CCSS A-CED.1 Create equations and inequalities in one variable and use them to solve problems. Include equations arising from linear and quadratic functions, and simple rational and exponential functions.
- CCSS A-CED.2 Create equations in two or more variables to represent relationships between quantities; graph equations on coordinate axes with labels and scales.
- CCSS F-BF.1 Write a function that describes a relationship between two quantities.
- CCSS F-BF.2 Write arithmetic and geometric sequences both recursively and with an explicit formula, use them to model situations, and translate between the two forms.
- CCSS F-IF.6 Calculate and interpret the average rate of change of a function (presented symbolically or as a table) over a specified interval. Estimate the rate of change from a graph.
- CCSS F-LE.1b Recognize situations in which one quantity changes at a constant rate per unit interval relative to another.
- CCSS F-LE.1c Recognize situations in which a quantity grows or decays by a constant percent rate per unit interval relative to another.
- CCSS F-LE.5 Interpret the parameters in a linear or exponential function in terms of a context.
How many hot dogs would Kobayashi have to eat to catch up to Sonya after Round n is over?
Also an interesting question to explore! Thanks for sharing.