
Listening to what was shared, I had so many questions including:
- What topics did they study?
- What grade levels did they study?
- What teaching models did they study?
- What was each teaching model about?
- How were sites selected?
- How were sites assigned a teaching method?
- How well did each site implement their teaching method?
- How conclusive were the results?
I also wanted to learn more about what I heard on the podcast including:
- How accurate was the description of what implementation was like?
- How did they assess a model’s success?
- What did the contemporary critique actually say?
I wanted answers to come directly from the actual report, and it took me a while to find it. Eventually I located it on the National Institute of Direct Instruction website as a scanned copy.
I’ve organized what I’ve found into two sections:
- Answering my questions using what I could find in the PFT final report
- Fact checking the podcast with what I could find in the PFT final report
Update 10/26/26
And now I also wonder if we’re all on the same page about the terms being used including:
- Is Direct Instruction the same as direct instruction?
- Is Direct Instruction the same as explicit instruction?
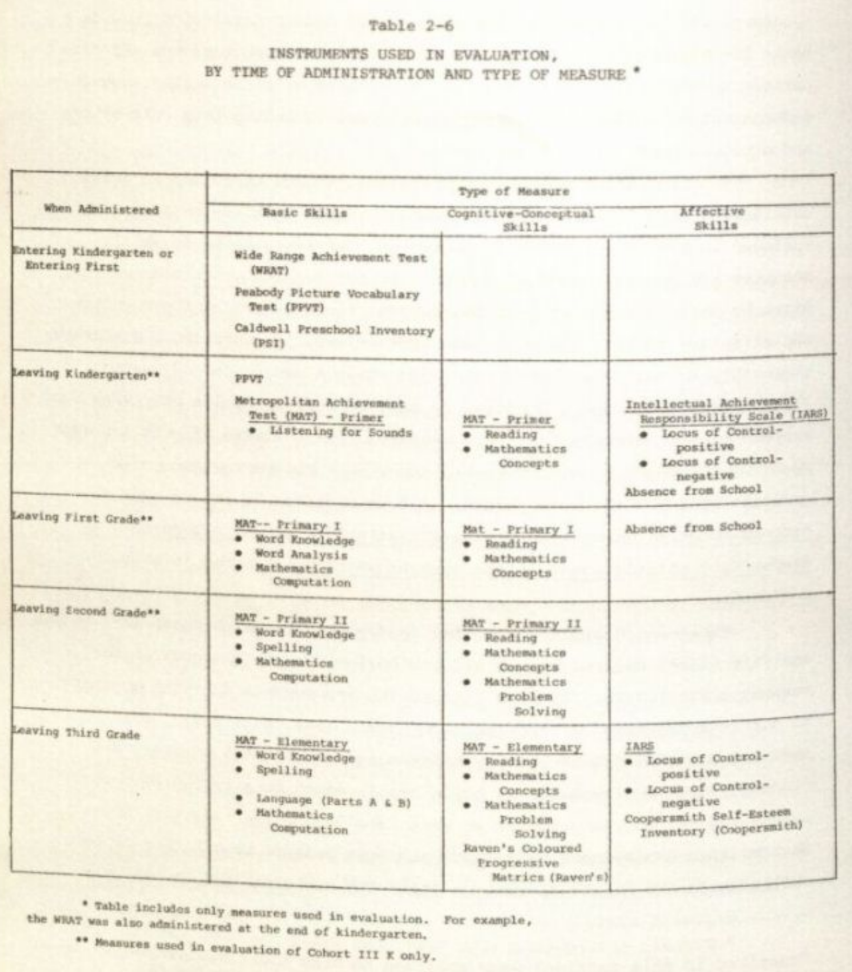
Here is the text for the specific topics which varied by grade level:
| When Administered | Type of Measure | ||
|---|---|---|---|
| Basic Skills | Cognitive-Conceptual Skills | Affective Skills | |
| Students entering kindergarten or entering first grade |
Wide Range Achievement Test (WRAT) Peabody Picture Vocabulary Test (PPVT) Caldwell Preschool Inventory (PSI) |
||
| Students leaving kindergarten |
|
|
|
| Students leaving first grade |
|
|
Absences from school |
| Students leaving second grade |
|
|
|
| Students leaving third grade |
|
|
|
Source:
Printed pg 36, PDF pg 61, Table 2-6
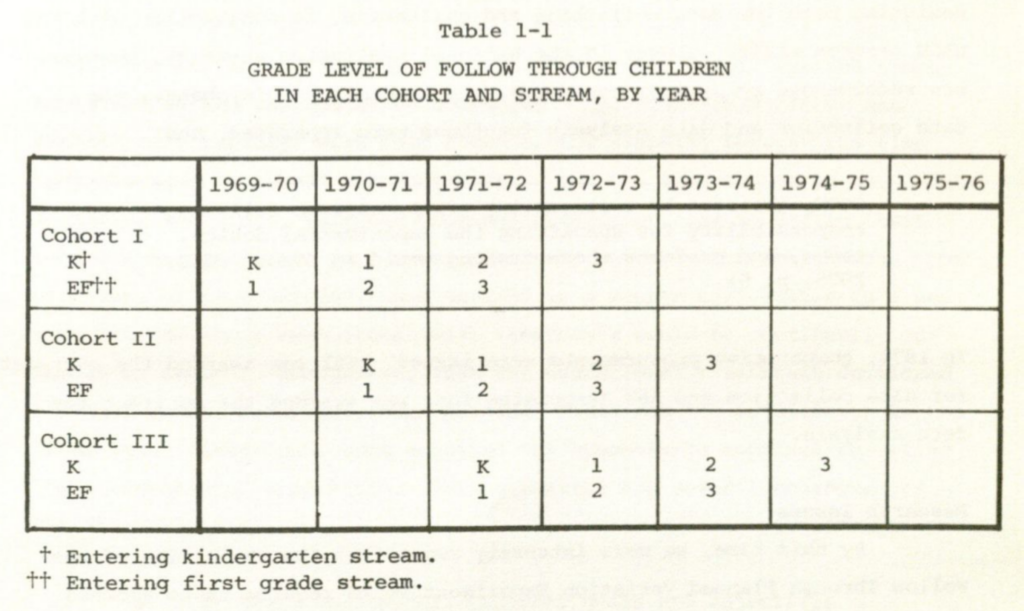
Sources:
Printed pg 7, PDF pg 32, Table 1-1 as well as lines 13 to 14
Printed pg 8, PDF pg 33, lines 1 to 5.
At one time Follow Through program embraced 22 sponsors working with 178 sites. These sponsors represented the spectrum of approaches to early childhood education existing in 1968-1971. This evaluation report includes evidence on the progress of children served by the 17 models listed in Table 2-1 (counting the five self-sponsored sites as a single model or group).
Below is Table 2-1. It’s hard to read, so I reproduced it in text.
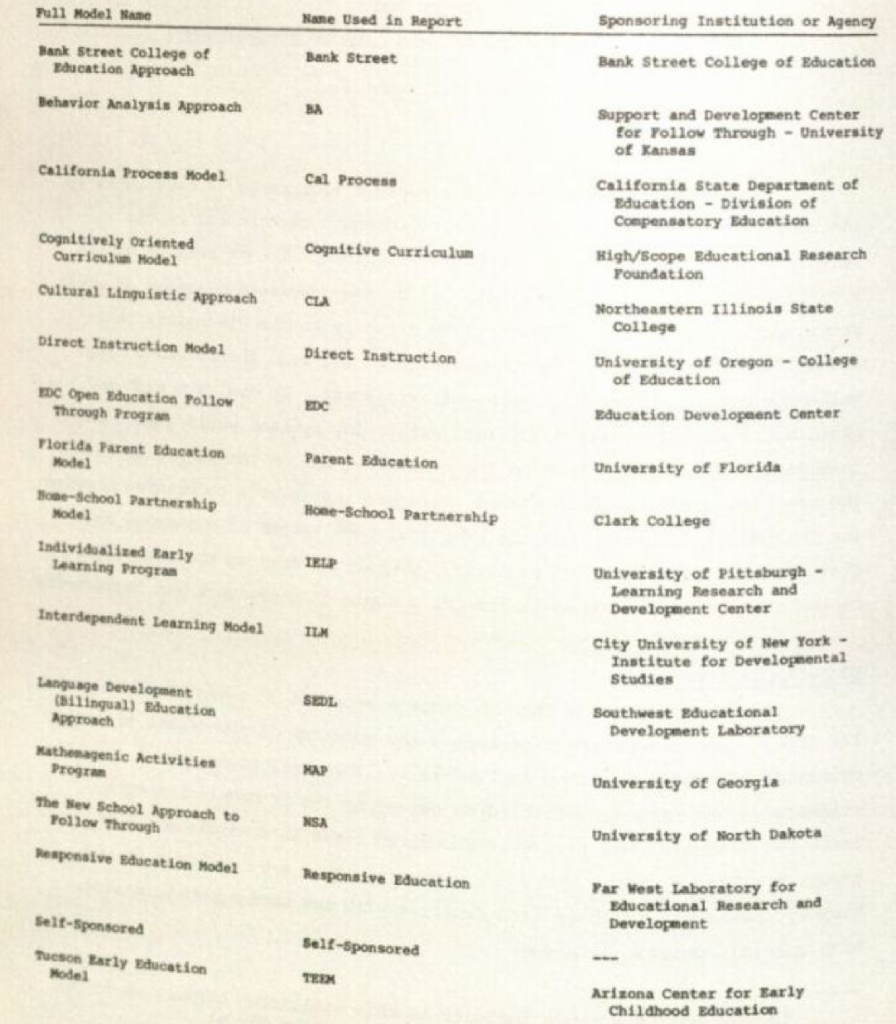
| Full Model Name | Name Used in Report | Sponsoring Institution or Agency |
|---|---|---|
| Bank Street College of Education Approach | Bank Street | Bank Street College of Education |
| Behavior Analysis Approach | BA | Support and Development Center for Follow Through – University of Kansas |
| California Process Model | Cal Process | California State Department of Education – Division of Compensatory Education |
| Cognitively Oriented Curriculum Model | Cognitive Curriculum | High/Scope Educational Research Foundation |
| Cultural Linguistic Approach | CLA | Northeastern Illinois State College |
| Direct Instruction Model | Direct Instruction | University of Oregon – College of Education |
| EDC Open Education Follow Through Program | EDC | Education Development Center |
| Florida Parent Education Model | Parent Education | University of Florida |
| Home-School Partnership Model | Home-School Partnership | Clark College |
| Individualized Early Learning Program | IELP | University of Pittsburgh – Learning Research and Development Center |
| Interdependent Learning Model | ILM | City University of New York – Institute for Developmental Studies |
| Language Development (Bilingual) Education Approach | SDEL | Southwest Educational Development Laboratory |
| Mathemagenic Activities Program | MAP | University of Georgia |
| The New School Approach to Follow Through | NSA | University of North Dakota |
| Responsive Education Model | Responsive Education | Far West Laboratory for Educational Research and Development |
| Self-Sponsored | Self-Sponsored | — |
| Tucson Early Education Model | TEEM | Arizona Center for Early Childhood Education |
Sources:
Printed pg 19, PDF pg 44, lines 16 to 18
Printed pg 20, PDF pg 45, Table 2-1
Bank Street College of Education Approach
The Bank Street approach is a rational, democratic life situation in the classroom. The child participates actively in his own learning and the adults support his autonomy while extending his world and sensitizing him to the meanings of his experiences. The teaching is diagnostic with individualized followup. There is constant restructuring of the learning environment to adapt it to the special needs and emerging interests of the children, particularly their need for a positive sense of themselves.
Source:
Printed pg 7, PDF pg 10, Lines 1 to 8
Behavior Analysis Approach
The behavior analysis model is based on the experimental analysis of behavior, which uses a token exchange system to provide precise, positive reinforcement of desired behavior. The tokens provide an immediate reward to the child for successfully completing a learning task. He can later exchange these tokens for an activity he particularly values, such as playing with blocks or listening to stories.
Source:
Printed pg 9, PDF pg 12, Lines 1 to 6
California Process Model
This is the only Follow Through approach for which a state agency is the sponsor. As the name implies, the model is dynamic and follows no single curriculum approach. It is in fact a cooperative effort of the state department of education and six California school districts. The approach is diagnostic-prescriptive; that is, the specific goals and objectives of each Follow Through community are determined by the Developmental Team in that community with the assistance of the sponsor. The local Developmental Teams include representatives from all elements of the Follow Through program including parents, teachers, aides, older students, representatives of the community, the sponsor, and funding agencies.
Source:
Printed pg 11, PDF pg 14, Lines 1 to 11
Cognitively Oriented Curriculum Model
The High/Scope Educational Research Foundation model represents a synthesis of research in preschool and early elementary education. The program recommends an “open framework” classroom that combines emphasis on active experience and involvement of the child; a systematic, consistent, and thoroughly planned approach to child development and instruction by the teacher; and continuous assessment of each child’s level of development so that appropriate materials and activities can be provided. This approach is based on the conviction that telling and showing do not teach, but that active experience with real objects does.
Source:
Printed pg 13, PDF pg 16, Lines 1 to 9
Cultural Linguistic Approach
In language elicitation episodes, the children are encouraged to express their thoughts, concepts, and ideas in their own language. These episodes are taped and analyzed by the teacher, and the information is used to develop initial reading materials and to plan future lessons. All subject matter, including math and science, is introduced to pupils in language episodes that take advantage of the child’s inherent oral capacity.
Source:
Printed pg 15, PDF pg 18, Lines 13 to 19
Direct Instruction Model
Using programmed reading, arithmetic, language, art, and music materials and behavior modification principles, the model employs strategies to teach concepts and skills required to master subsequent tasks oriented toward a growing level of competence. Emphasis is placed on learning the general case, i.e., developing intelligent behavior, rather than on rote behavior. Desired behaviors are systematically reinforced by praise and pleasurable activities, and unproductive or antisocial behavior is ignored.
Source:
Printed pg 47, PDF pg 50, Lines 7 to 13
EDC Open Education Follow Through Program
The child’s experience is one of the starting points for teaching in an open classroom; the teacher’s input is another. The role of the teacher is an active one. Teachers lead children to extend their own projects, through thoughtful responses and suggestions. The classroom is carefully supplied with materials that are likely to deepen children’s involvement.
Source:
Printed pg 19, PDF pg 22, Lines 24 to 28
Florida Parent Education Model
As the name of this model implies, its primary focus rests on educating parents to participate directly in the education of their children and motivating them to build a home environment that furthers better performance on the part of the child both in school and in life. Basic to the model is recognition of the fact that parents are a key factor in the emotional and intellectual growth of their children and that they are uniquely qualified to guide and participate in their children’s education.
Source:
Printed pg 21, PDF pg 24, Lines 1 to 7
Home-School Partnership Model
A parent aide program, an adult education program, and a cultural and extra-curricular program are the principal elements of this model. The model aims to change early childhood education by changing parent, teacher, administrator, and child attitudes toward their roles in the education process. It is believed this can be done by motivating the home and school to work as equal partners in creating an environment that supports and encourages learning.
Source:
Printed pg 25, PDF pg 28, Lines 1 to 7
Individualized Early Learning Program
A test for each objective in the sequence of teaching confirms that prerequisite skills have been acquired. Thus the curriculum specifies skills the student needs to enter the curriculum at any point and obviates wasting time on skills he already has. A special effort is made to help the child develop the self-management skills complementary to such a curriculum. An exploratory program under development provides opportunities for the child to apply and extend his skills and concepts in a relatively informal and open-ended environment.
Source:
Printed pg 27, PDF pg 30, Lines 16 to 23
Interdependent Learning Model
Games are a central feature of the ILM model, often being used in combination with certain aspects of programmed instruction to achieve instructional and social objectives. Since the focus is on “learning to learn,” curriculum content is not specific, although suggested games dealing with specific content areas, such as language, are being developed. In introducing new games the teacher typically follows a strategy of teaching from within; she demonstrates how to play by actually playing the game with a group, verbalizing what is being done and why and serving as a model rather than actually teaching; ultimately she transfers much of the control to the game rules, encouraging the children to direct their own learning.
Source:
Printed pg 29, PDF pg 32, Lines 17 to 26
Language Development (Bilingual) Education Approach
The theory applied by the model is that concepts first learned in the dominant language can easily be transferred later to a second language. Step-by-step sequenced procedures are followed in teaching language patterns, and both teaching techniques and materials are designed to develop a hierarchy of thinking processes, specific terminology, and symbols. Drills, games, and exercises are used to overcome individual linguistic problems.
Source:
Printed pg 31, PDF pg 34, Lines 9 to 15
Mathemagenic Activities Program
An activity-based curriculum is essential to this model since it postulates active manipulation and interaction with the environment as the basis for learning. Individual and group tasks are structured to allow each child to involve himself in them at physical and social as well as intellectual levels of his being. Concrete materials are presented in a manner that permits him to experiment and discover problem solutions in a variety of ways.
Source:
Printed pg 33, PDF pg 36, Lines 7 to 13
The New School Approach to Follow Through
The approach is not so concerned with instructional content as the processes by which content is taught and the conditions under which children learn. The goal of the approach is to create classrooms in which children continue to wonder and imagine; are open and honest and respectful of themselves, adults, and other children; are intensely involved and led by their natural curiosity to concern and commitment; initiate activities and take responsibility for their own learning; and are willing to face uncertainty and change with confidence. Classrooms responsive to these dicta are each likely to develop their own unique character.
Source:
Printed pg 35, PDF pg 38, Lines 8 to 17
Responsive Education Model
In the Responsive Model classroom the child is free to explore within a carefully controlled environment containing learning centers and a variety of games and activities. There is freedom to choose activities within already established limits. What he chooses to do is more likely to become important to him, to stimulate affective involvement, and to pose real problems. The child searches for solutions to problems in his own way, using a variety of resources, both physical and human. The teachers guide his discovery of solutions.
Source:
Printed pg 39, PDF pg 42, Lines 24 to 31
Self-Sponsored
In addition to sponsored projects, there are a few projects from the early group of pilots preceding the planned variation phase of Follow Through who elected to remain unsponsored (the only projects given this option). They are classified as self-sponsored or parent implemented and have instituted programs they themselves have developed.
Source:
Printed pg 3, PDF pg 7, Lines 31 to 35
Tucson Early Education Model
The model calls on teachers to individualize their teaching and emphasizes persistent adult-child interaction on a one-to-one basis. To meet the needs and learning rates of individual children, the model provides a great variety of behavioral options, including both self-selected and structured activities.
Source:
Printed pg 45, PDF pg 48, Lines 7 to 11
School districts were selected from those initially nominated by state, school, and OEO officials. The criteria used in selecting the districts indicate that the program administrators were less concerned with the effect of the selection process on the external validity of the results than they were with choosing districts with a high probability of success in the first year of the program.
Sources:
Printed pg 3-4, PDF pg 28 line 17 to pg 29 line 7
The process of matching the sponsor with the school districts began in late February, 1968, when 14 potential sponsors and “hundreds of representatives of school districts, Head Start Programs, Community Action Agencies, parent groups, and state agencies were brought together.” The sponsors at this meeting made presentations on their approaches while the community representatives and school officials listened, each seeking a sponsor who seemed compatible with local needs and attitudes. At the conclusion of this meeting, districts selected their sponsors. Some districts affiliated with their first choice; others, because of the need to distribute sponsors among sites, with their second or third choice. Other districts exercised their option not to affiliate but to become what is know[n] as “self-sponsored;” i.e., the local school district would take responsibility for developing its own model.
Sources:
Printed pg 3-4, PDF pg 28 line 17 to pg 29 line 7
Perhaps our clearest finding is that each model’s performance varies widely from site to site. An unknown proportion of this variation results from implementation problems, of which we have no analytically useful record.
I interpret this to mean that the same teaching model could have very different results at different sites, and the researchers couldn’t determine how much of those differences was due to how well the model was implemented.
We turned our primary attention from the study of model average effects to that of site effects, so as not to obscure the results of good implementations by averaging them with those of the bad ones. Most of the models were tried out in enough sites that one might reasonably expect at least one good implementation.
I interpret this to mean that the researchers chose to look at how each teaching model performed at individual sites rather than just looking at the average results across all sites. They believed that if a model was used at enough sites, at least one sites would probably implement it well. However, because they couldn’t determine which sites actually implemented the model well, they couldn’t know whether differences in results were caused by implementation or something else.
In a practical sense, we can be fairly confident that a model can produce at least as much progress as it showed in its best site. On the other side of the coin, the same model can clearly do at least as badly as it did in its worst site.
I interpret this to mean that the researchers believed the best and worst results for each teaching model provided examples of how well or poorly the model might perform. However, because they couldn’t determine how well those sites implemented the model, they couldn’t predict whether other sites would have similar results.
Lacking information about implementation (what if a model did best in a site that had not implemented it well?), we can only give the models the benefit of the doubt in this matter.
I interpret this to mean that the researchers couldn’t determine whether sites with strong results had actually implemented the teaching model well. Similarly, they couldn’t determine whether sites with poor results had implemented it poorly. Accordingly, they couldn’t tell how much of the differences in results were due to implementation versus other factors that varied between sites.
Source:
Printed pg 166-167, PDF pg 191 line 19 to pg 192 line 2
The results of our analyses imply a number of conclusions about the performance of Follow Through children. Since Project Follow Through is a quasi-experiment, these results are subject to alternative interpretations, some deriving from our analytic methods and others from broader insights on the complicated reality that a wide-ranging yet incomplete set of measures cannot help oversimplifying.
Questions that could legitimately be raised include:
1. Might differential attrition of pupils from FT and NFT groups over the four years of treatment bias the evaluation results?
2. Are we using the best possible model to assess the effectiveness of Follow Through? How adequate is our covariate set, and are the results we find dependent upon the particular covariates we selected?
3. Can we meet the assumptions our analyses make about how the data are distributed?
4. How comparable are the results from different analyses?
5. What relationships exist among effects from different analyses?
With respect to each question above, we present results of some auxiliary analyses performed on Cohort III-K that should enhance the plausibility of our analytic procedures. These results are neither complete nor exhaustive. In this quasi-experimental context, we cannot hope to lay all doubts and objections to rest, but we have expended considerable effort to check our conclusions, with the effect of reinforcing our confidence in the results.
Source:
Printed pg 81-82, PDF pg 106 line 16 to pg 107 line 7
It was a tense dynamic sometimes — these young people coming in, telling veteran teachers to do things differently.
Andrist: I had a couple of teachers who just were really negative.
Allen: I was hated a lot.
This is Adrienne Allen again.
Allen: Because I was a policeman. I went in and made sure that they were following the script.
There were teachers who did not like those Direct Instruction scripts. They wanted to do their own thing.
Allen: Some of them would lock the door, and they would pull down the shade so that I couldn’t see in the classroom or go into the classroom.
She had supportive principals who would help her out. But some principals were not supportive. And there were other obstacles. This is Jerry Silbert again.
Silbert: I remember one site — we did a training for a week or two. And then the teachers got transferred. So, school starts and we’re missing half the teachers who were trained.
Other programs being tested as part of Project Follow Through were facing similar challenges.
Larry Schweinhart: I remember in one classroom….
Larry Schweinhart worked on a program called High/Scope.
Schweinhart: The teacher was doing business as usual and she looked up at me when I came in and she said, “Do you want me to do the High/Scope now?”
She wasn’t doing the program. It’s not clear why. But it’s not that surprising that some teachers were reluctant. These were new, untested ways of teaching.
It was up to the program developers to get teachers on board. To figure out how to make the educational ideas they believed in work in the real world.
Source:
pg 4 lines 2 to 22
Report
There has been no adequate assessment of whether the sponsors’ evolving programs were implemented. We have, therefore, had no way to address the research issue, “Do differences of implementation of an educational strategy have any relationship to differences in impact?”
Source:
Printed pg 10, PDF pg 35 lines 7 to 12
Measuring all those things was going to be difficult. How do you know if a program has succeeded in helping a child become independent or creative? And even if you can reliably measure those things, how are you going to compare programs to each other if they have such different goals?
Source:
pg 5 lines 6 to 8
Report
To evaluate each model’s performance on every measure of interest to any sponsor would impose unreasonable costs and burdens on the evaluation and on the people involved; the measures actually administered therefore represent a compromise between the demands of diversity and the practical constraints of resources and available instruments. Unfortunately, we have no data on the adequacy or costs of this compromise so it remains a topic of conjecture and controversy.
Source:
Printed pg 19, PDF pg 44 lines 10 to 16
Podcast
They thought it was a messy study that could have been set up better. The measures weren’t perfect. And they concluded some of the government’s statistical analysis was flawed.
Source:
pg 5 lines 6 to 8
Critique
“They thought it was a messy study that could have been set up better.”
The whole classification scheme was vague and ill-defined. No check on the validity of the classification is reported, even though it shaped the findings.
“The measures weren’t perfect”
Not only were outcomes such as improvements in personality and character not measured, but even such straightforward skills as the ability to read aloud, to write a story, or to translate an ordinary problem into numbers went unassessed. Both explicit and implicit goals of primary education in almost all schools are much broader than the measures used, and it would be reckless to suppose that the results of the testing indicate the attainment of these broader goals.
“And they concluded some of the government’s statistical analysis was flawed.”
Abt Associates analyzed test scores so that the number of students in the models influenced how good the models appeared to be. When this irrelevant influence is removed from the analyses, a different order of effectiveness is found. The Abt Associates’ ordering of models by effect is thus suspect.
Source:
Printed pg 463, PDF pg 2
DI vs. di: The Term “Direct Instruction”
The term direct instruction was first used in 1968, when Science Research Associates published a beginning reading program called DISTAR, authored by Siegfried Engelmann and his colleagues. Since 1968, the use of the term direct instruction has evolved in two main directions: DI and di.
Direct Instruction (DI)
In the 1960’s, Zig Engelmann created this explicit, carefully sequenced and scripted model of instruction. Published Direct Instruction programs are based on a landmark empirical research study and numerous follow-up studies over the last thirty years about how children actually learn. Project Follow Through (1967), the largest educational experiment ever conducted, evaluated nine major approaches to educating at-risk students. Only students taught with the Direct Instruction approach consistently outperformed control students on basic, cognitive, and affective measures. Direct Instruction is sometimes referred to as “capital DI.”
direct instruction (di)
In his 1976 teacher effectiveness research, Barak Rosenshine gave this term to a set of variables found to be significantly related to student achievement. This set of variables included engaged time, small group instruction, and specific and immediate feedback. This approach is often referred to as “small di.”
I interpret this to mean that while there is significant overlap between the two, there are also notable differences. For example, Direct Instruction (DI) typically uses carefully developed, scripted lessons that teachers are expected to follow closely, whereas lowercase direct instruction (di) does not.
Source:
Archived version of National Institute for Direct Instruction website from June 14, 2026
It is important to point out that although Direct Instruction includes the majority of the elements of explicit instruction and is based on such principles as increasing on-task behaviors, high levels of success, and content coverage, it is distinguished from explicit instruction by its emphasis on curriculum design (Stein, Carnine, & Dixon, 1998). Aside from this curriculum- based distinction, the overlap of teaching procedures is extensive.
Source:
Explicit Instruction: Effective and Efficient TeachingChapter 1, page 15, lines 5 to 10
I believe that the podcast is only talking about Direct Instruction, not direct instruction. Personally, I didn’t even know that there was a Direct Instruction (uppercase DI) until I listened to this podcast. It is likely that people use this podcast about Direct Instruction to make a case for direct instruction and explicit instruction.
By the early 1990s — 15 years after Thaddeus Lott had become principal — Wesley had become not only one of the highest performing schools in Houston. It had become one of the highest performing schools in the entire state of Texas.
Thaddeus Lott stayed on. He was the principal of Wesley Elementary School for 20 years. Doing Direct Instruction the entire time.
The first few principals that came after him kept Direct Instruction going. But eventually, a new principal came in with her own ideas. And got rid of Direct Instruction. We tried many times to contact her to ask why — but she never got back to us.
Thaddeus Lott died, in 2015 at the age of 81. By that time, Wesley Elementary was once again one of the lowest performing schools in Houston.
These quotes make many claims, and without the podcast citing its sources, they are challenging to confirm. Below is a table of data I constructed. You can read my interpretations of the data as well as the concerns I have with the data. These same concerns also potentially apply to the data the podcast used.
The podcast references data from “the early 1990s” up until “2015” and this data is from Grade 3 Wesley Elementary standardized test scores.
| Year | Math | Reading | Test | Math & Reading Standards | Principal (gender) | Sources |
|---|---|---|---|---|---|---|
| 1992 | 90.4% | 89.4% | TAAS | Essential Elements | Thaddeus Lott (male) | A, P |
| 1993 | 94.6% | 98.4% | TAAS | Essential Elements | Thaddeus Lott (male) | A, P |
| 1994 | Missing | Missing | TAAS | Essential Elements | Thaddeus Lott (male) | P |
| 1995 | Missing | Missing | TAAS | Essential Elements | Thaddeus Lott (male) | P |
| 1996 | Missing | Missing | TAAS | Essential Elements | Wilma “Suzy” Rimes (female) | Q |
| 1997 | Missing | Missing | TAAS | Essential Elements | Wilma “Suzy” Rimes (female) | Q |
| 1998 | 92% | 100% | TAAS | Essential Elements | Wilma “Suzy” Rimes (female) | F |
| 1999 | 64% | 82% | TAAS | TEKS | Wilma “Suzy” Rimes (female) | F |
| 2000 | 82% | 94% | TAAS | TEKS | Wilma “Suzy” Rimes (female) | F |
| 2001 | 95% | 99% | TAAS | TEKS | Sandra Cornelius (female) | F |
| 2002 | 100% | 89% | TAAS | TEKS | Sandra Cornelius (female) | F |
| 2003 | 96% | 98% | TAKS | TEKS | Sandra Cornelius (female) | G |
| 2004 | 91% | 98% | TAKS | TEKS | Sandra Cornelius (female) | G |
| 2005 | 81% | 88% | TAKS | TEKS | Tammie Daily (female) | G |
| 2006 | 60% | 89% | TAKS | TEKS | Kimberly Agnew (female) | I |
| 2007 | 75% | 74% | TAKS | TEKS (math revised 2006 & reading original) | Kimberly Agnew (female) | I |
| 2008 | 87% | 87% | TAKS | TEKS (math revised 2006 & reading original) | Kimberly Agnew (female) | I |
| 2009 | 89% | 80% | TAKS | TEKS (math revised 2006 & reading original) | Kimberly Agnew Borders (female) | I |
| 2010 | 92% | 88% | TAKS | TEKS (math revised 2006 & reading revised 2008) | Kimberly Agnew Borders (female) | J |
| 2011 | 90% | 87% | TAKS | TEKS (math revised 2006 & reading revised 2008) | Kimberly Agnew Borders (female) | J |
| 2012 | 60% | 45% | STAAR | TEKS (math revised 2006 & reading revised 2008) | Kimberly Agnew Borders (female) | K |
| 2013 | 73% | 74% | STAAR | TEKS (math revised 2006 & reading revised 2008) | Kimberly Agnew Borders (female) | K |
| 2014 | 33% | 55% | STAAR | TEKS (math revised 2006 & reading revised 2008) | Rhonda LeDuff (female) | K |
| 2015 | 44% | 48% | STAAR | TEKS (math revised 2012 & reading revised 2008) | Rhonda LeDuff (female) | L |
Sources
A. Texas Education Agency. 1992-93 Wesley Elementary Campus AEIS Report, Lines 10, 14, 20, and 24
F. Houston ISD. District and School Profiles 2001-02, Printed pg 649; PDF pg 610; Grade 3 TAAS table.
G. Houston ISD. District and School Profiles 2004-05, Printed pg 661; PDF pg 674; Grade 3 TAKS table.
I. Houston ISD. District and School Profiles 2008-09, Printed pg 649; PDF pg 662; Grade 3 TAKS table.
J. Houston ISD. District and School Profiles 2011-12, Printed pg 599; PDF pg 612; Grade 3 TAKS table.
K. Houston ISD. District and School Profiles 2013-14, Printed pg 365; PDF pg 374; Grade 3 STAAR table.
L. Houston ISD. 2015 STAAR Mathematics, Printed pg 8; PDF pg 10; Table 4a, Wesley ES.
P. Thaddeus Lott, congressional testimony. Congressional testimony (March 1998) Printed pg 92, PDF pg 96, line 10
Q. Texas Center for Educational Research. Patterns of Success (1997), PDF pg 14; Wesley profile.
I am going to assume that “few” means three or more and that “her” means it was a female principal. The first few principals after Lott were Suzy Rimes, Sandra Cornelius, and Tammie Daily. So they all did Direct Instruction. The fourth and fifth principals after Lott were Kimberly Agnew Borders and Rhonda LeDuff. LeDuff was principal until 2018, when a male principal took over. So, I am going to assume that either Agnew Borders or LeDuff was the principal who stopped using Direct Instruction.
If Kimberly Agnew Borders stopped using Direct Instruction…
If this is what happened, then let’s focus on the first third graders who would have had no experience with Direct Instruction. They would have been kindergarteners in 2006, first graders in 2007, second graders in 2008, and third graders in 2009.
There’s no great way to compare test scores. So, I’ll share that in the last two years that we have data from Lott (1992 and 1993), his students scored 90.4% and 94.6% in math as well as 89.4% and 98.4% in reading. In the first two years where Agnew Borders’ students came up without any Direct Instruction (2009 and 2010), they scored 89% and 92% in math and 80% and 88%. So if Agnew Borders stopped using Direct Instruction, this does not show the decline in scores I would have expected.
If Rhonda LeDuff stopped using Direct Instruction…
If this is what happened, then let’s focus on the first third graders who would have had no experience with Direct Instruction. They would have been kindergarteners in 2013, first graders in 2014, second graders in 2015, and third graders in 2016.
Again, there’s no great way to compare test scores. We already found that in the last two years that we have data from Lott (1992 and 1993), his students scored 90.4% and 94.6% in math as well as 89.4% and 98.4% in reading. The first two years where LeDuffs’ students came up without any Direct Instruction would be 2016 and 2017. So the students whose test scores we’re looking at in 2015 had three years of Direct Instruction (in kindergarten, first grade, and second grade) while third grade used a different method. So if LeDuff stopped using Direct Instruction, this does show the decline in scores I would have expected.
What is worth noting though is that if Agnew Borders kept Direct Instruction going, then her students’ test scores dropped from 90% (math) and 87% (reading) in 2011 to 60% (math) and 45% (reading) in 2012. It must be said that 2012 was the first year that Texas used the new STAAR test. So if Agnew Borders’ students were still using Direct Instruction, then even with Direct Instruction, scores dropped from from 90% to 60% in math and 87% to 45% in reading. If we then use 60% and 45% as the new baseline for students’ scores with Direct Instruction, math scores dropped from 60% to 44% in math but raised from 45% to 48% in reading.
- The podcast never states what grade levels they are referring to. From what I could find, in “the early 1990s”, the TAAS test only measured grades 3, 5, 7, 9, and 11. Other grade levels were tested in later years.
- My conclusion: The only grades that had test scores for all these years were grades 3 and 5. I picked grade three to analyze since that grade was part of the Project Follow Through study.
- Texas changed their content standards multiple times between the early 1990s and 2015. Initially, they were using standards called Essential Elements until 1998. They changed to the TEKS in 1999 and then revised the math TEKS in 2006, the ELA TEKS in 2008, and the math TEKS again in 2012. They also changed their standardized tests multiple times as they were using the TAAS test until 2002, then the TAKS test until 2011, and then switched to the STAAR test in 2012.
- My conclusion: I don’t know how valid it is to compare standardized test scores from different tests that were measuring different standards, but that is what I am doing and what I am assuming that the podcast did too.
- I cannot find data for 1994, 1995, 1996, and 1997. I tried multiple TEA websites including this one, this one, and this one (which would give me everything I need) and they all gave me error messages. I even emailed the University of Texas at Dallas Education Research Center Data Holdings and was told that “access is restricted exclusively to our ERC researchers.”
- My conclusion: If you have a way to get the verifiable data, please send it my way. The Wesley campus number is 101912254.
Facts
I am using my imperfect table of data until the podcast shares the data they are using.
Conclusion A
It appears that the conclusion the podcast wants us to come to is that when Wesley Elementary stopped using Direct Instruction, test scores dropped. That is certainly a possible conclusion.
Conclusion B
Another possible conclusion is that in 2012, Texas changed their standardized test from TAKS to STAAR. Texas described the new test saying that “the STAAR program represents an increase in rigor when compared with TAKS” (pg 12, question 38). They explained that they changed the test because (pg I-27 lines 24 to 34):
- Tests will contain a greater number of items that have a higher cognitive complexity level.
- Items will be developed to more closely match the cognitive complexity level evident in the TEKS.
- In reading, greater emphasis will be given to critical analysis than literal understanding.
- In writing, students will be required to write two essays rather than one. The writing prompts will support analytical, persuasive, and expository writing in addition to literary writing.
- In social studies, science, and mathematics, process skills will be assessed in context, not in isolation, which will allow for a more integrated and authentic assessment of these content areas.
- In science and mathematics, the number of open-ended (griddable) items will increase to allow students more opportunity to derive an answer independently.
So, perhaps test scores dropped because while Direct Instruction worked well with previous standards, as the Texas Education Agency said in 2011, “the current mathematics TEKS have served Texas citizens well, identifying clear expectations and setting high standards; however, the world is changing and many careers now require more and different mathematics, including an emphasis on mathematical reasoning and complex problem-solving.” So maybe test scores dropped because many years of Direct Instruction did not adequately prepare students for this level of rigor.
Conclusion C
It seems like Principal Lott was a remarkable person. Here’s a quote about him from the podcast:
Killion: And he wouldn’t just like walk in. He would take a chair, and he would stay for periods of time. Maybe half an hour to an hour. To a lot of people, it was unnerving to be watched under a microscope, so to speak. To me, I felt like he really cared. He would give you a pat on the back if you deserved it. But he would also point out things that he thought you could do better. He wanted everyone to meet the standards that he thought it was going to take for his school to be successful.
I have been in education for over two decades and I don’t recall ever hearing of a principal who spent their time this way. So, another conclusion is that Lott built a culture of excellence and dedication that impacted students (and their test scores) for years to come.
I appreciate you doing all his work to fact check. Often in education people, higher Ed, companies, etc. claim to have the “evidence” yet when you dig in, the research design measured something different. For example, the notion of “Direct Instruction” is never consistently defined and there is no agreement in the school Psych world or math education world of what hat exactly is if each classroom is approaching it the same as well as varying mental models of what it is. Personally I think Sold A Story, sold us a story.
Thank you, Anne. I am hoping this information helps everyone have a more complete picture of Project Follow Through.
Agreed, 100%
For whatever reason, I have only recently realised the importance of the School of Education being under the umbrella of Social Sciences. Does that mean it is somewhere between Sociology and Psychology? Anyway, it is not an exact science governed by laws like engineering, physics or chemistry. It is is also not business – input gadget at a cost price, determine a sale price and calculate the profit. At best we can have guidelines or frameworks but working with people means it is not as simple as crank the handle of whatever educational philosophy you ascribe to produce the same result every time. The sooner governments, academics and business people realise teachers ands students are not KPIs, the better.
Thanks for sharing this, Christine. You remind me of this blog post I wrote almost a decade ago: https://robertkaplinsky.com/is-problem-solving-complex-or-complicated/
Teaching children how to do mathematics is complex but we’re using assessments that treat it like it’s complicated.
Such. a good point!
First- thank you so much for not only finding this research, but breaking it down for us. You’re a true gem in our community. I think it’s interesting that the people who are pushing Direct Instruction are the same people who are saying “don’t tell me how to teach” to new curriculum and using TPT instead. If we came to those same teachers and asked them to teach from a script and have students call out answers the way the videos from this podcast look, they’d be horrified. In my opinion, the comment above about the unclear definition of Direct Instruction is the real issue. What I see people saying is Direct Instruction is actually lecture. I appreciate your disclosure at the top about needing a variety of instructional strategies. There is a time for fluency, modeling, and supported problem solving. This needs to be more prevalent because teachers really think the research says to let kids go and hope they figure things out. There’s truly no one way to do the “art” of teaching.
Thank you, Lauren. Yes, one thing I am learning from this podcast is that direct instruction does not mean the same thing to everyone.
For example, I used to use the terms direct instruction (lower case D and I) and explicit instruction, interchangeably. To me, these terms meant a style of teaching that is more teacher led where the teacher is telling the students what to do and how to do it.
I actually did NOT know that there was a very specific Direct Instruction (upper case D and I) model which is heavily scripted and involves choral responses.
My best guess is that if you asked people to define “Direct Instruction”, you’d get a variety of responses, just like you would with defining “Inquiry-based Instruction”. And to me that makes this discussion challenging because we may not be talking about the same things even though we’re using the same terms.
I could say a lot about this. My master’s capstone was based on using mixed methods of instruction for students in intervention. I teach and also direct a team of interventionists. I’ve found that a mix of strategies work for teaching students a new topic. (I do like a lot of your methods for this.)
However, when students are behind, I’ve found that explicit instruction in the areas where they struggle is the key to helping them fill in knowledge gaps and catch up. The trick is to be understand exactly where the students struggle. The very best method that people say has worked miracles for their students is when I can sit with them, observe them working on their grade level material, see where they get stuck, and explicitly or directly teach them how to do whatever they have not mastered (adding fractions) etc.
I’ve used this method to help elementary through college students and it’s nothing short of amazing.
Thanks, Rebecca. Everything you shared sounds perfectly reasonable. The one point I’ll call out (that I’m realizing is a big problem) is the question of whether Direct Instruction = direct instruction = explicit instruction.
I had always thought that direct instruction = explicit instruction and I had no idea that there was actually a specific Direct Instruction model with scripted curriculum. So I do not think that Direct Instruction = direct instruction
What it seems is that DI and di are getting used interchangeably and that while the podcast is talking about DI, people are interpreting it as meaning it is about di.
Ah, yes. I had the same thought and agree. In fact, if it were scripted it would undermine it entirely.
Wow, I’m about to send this link to so many friends and colleagues! Thank you so much for your hard work!
Thank you so much! I’m really hoping this will be useful for people looking for additional context.
Robert, thanks so much for getting this on our radar and for doing so much legwork to get to the original Project Follow Through (PFT) study and data. I’ve shared your post with a group of 100+ math ed colleagues across Michigan. What I haven’t yet seen come out in “Science of Math” and now with this “Direct Instruction” piece is that, after all the Math Wars, there is starting to be recognition that there is continuum of teaching strategies ranging from completely teacher directed (like some of the classroom examples shared in the “Sold a Story 2” episodes) to completely student directed (student-driven free inquiry). And, we have evidence that neither end of that continuum is good for most students day after day, month after month. In a perfect world, teachers would be trained/equipped to strategically and intentionally implement the needed level of teacher/student direction based on what is to be learned (skills? concepts? strategic thinking? fluency?) and where students are in their learning. We have a lot of challenges to reach a goal like that. Your work has been helping! 🙂
That’s what I find perhaps least helpful about the podcast: reinforcing this false dichotomy that one way is the right way and the other way is awful.
I think we’d all be better off focusing our energy elsewhere.
I completely agree. Thank you for this meticulous work.
This is fascinating because as I read this I realized that this study started the year I was born and for many reading this far before their year of birth. I work in the school district in which I attended K-8. There have been times where I have said if we are still doing it the way it was done when I went to school we may have a problem. And there are things that I experienced in school that are no longer being done that maybe should have continued. (I remember my gross motor skills being tested.)
In other words, how can a study done nearly 60 years ago have the same relevance today?
(Also, I was trained on Explicit Direct Instruction (that is what the trainers called it) in the early 2000s. There are some elements and strategies that I still use today when I am teaching. When I used it for math (we wrote our lessons following their template) the majority of the lesson was to practice the steps of the algorithm. I remember being taught a 7 step lesson plan and at best 2 of those 7 addressed conceptual learning.
Yes, an aspect of this study that I haven’t really talked about is this wondering: “When does a study from 50+ years ago that compared a teaching method against other methods that no longer exist cease to be relevant?”
Thank you for always being such a valuable voice and for breaking things down. I had not listened to the podcast but I truly appreciated the research and perspectives you shared.
In a recent workshop I facilitated, we read some vignettes that illuminated both ends of the continuum and a teacher stopped me and asked, “Are these really the only 2 options?” That question has stayed with me.
Too often, conversations and podcasts become framed as choosing the “right” approach. While many passionately defend their position, that binary thinking can overlook the complexity of learning.
As educators we must honor the delicate balance required while navigating the messiness that is learning.
Cheers to the researchers and practitioners who approach teaching and learning with curiosity and a commitment to finding the balance that best serves their students.
I wonder if this analogy is appropriate, but maybe it’s like which cuisine is better: Japanese, Mexican, or Italian?
The correct answer is “Who cares which is best? My life is better when I get to choose between all three?”
Why are we all fighting so hard to demonize one and celebrate the another???
I appreciate the “deep dive” fact check you have provided. Our field needs to, at minimum, pay attention to all “components” of Sold A Story. Would love to chat about this, if you would like to do so.
One of the issues that concerns me is that much of what is noted regarding direct instruction in “Sold A Story” while accurate is dated. Both “big D” and “little d” direct instruction have been around for some time – from an educational psychology perspective. Research in mathematics education focusing on the importance of problem solving, engaging students in doing mathematics, the importance of conceptual understanding, and MANY of “our beliefs” by comparison are more recent. Consider that the JRME was first published in 1970!!!
Thank you for doing this…!
Hi Skip. Thank you reading and commenting. Yes, I don’t understand all the fervor for trying to prove that one model is superior when bias exists in pretty much all research. I’d much prefer research to focus on which pedagogy is more effective in which situations.
For example, there are ABSOLUTELY times when direct instruction (lower case) or explicit instruction makes much more sense to use than inquiry-based instruction. So it seems pointless to try and fight about which one is best.
Dude,
Well researched! I found there to be some nuggets of truth in the podcast episodes, but there is a lot being wagered on a single 50-year story of a charter school led by someone with limited credentials (though very good intentions). Like you, I have worked in the system long enough to know that direct instruction (lower case di) is still the predominant model of math teaching in America. Therefore, I do not see this making as great of an impact as the Season One did with reading. However, I am concerned that it will stop leaders of schools from looking to change instructional practices of their faculty.
As always, keep up the great work, my friend.
Chris Shore
Thanks for chiming in, Chris. I don’t feel confident enough to make any predictions about how this all plays out. My hope is that we shift the conversation from “which method is always better” to “which methods work better for which topics/situations”
I will be bold and make a prediction! I predict that state legislatures will begin mandating ‘direct instruction’ for math. In California, where I work, I predict that we will have a new Teaching Performance Expectation 8 (mirroring the TPE 7 about reading) that teacher education programs will be required to address. Maybe not though because Chris is right–most K-5 math instruction has always been direct instruction. I will be glad if it turns out that a daily diet of ‘let’s fill out the workbook pages together’ becomes recognized as an inadequate math instruction method.
One thing that’s important to note is that you wrote that “most K-5 math instruction has always been direct instruction,” but right there is one of the problems.
This podcast is not about direct instruction (lowercase di). So far, it’s all about Direct Instruction only (uppercase DI). So there is gonna be a lot of confusion.
I guess we’ll have to see how this plays out.
Finding that the Follow Through evaluation kept no useful records of site-level implementation makes comparing those sponsor models feel far less clear-cut.
Hi Nora. I don’t believe I dug deep enough to confirm that “the Follow Through evaluation kept no useful records of site-level implementation.”
That being said, I can absolutely empathize with how hard it would have been to track implementation. And I do think that the researchers try to articulate that well. I just wish that was more clearly communicated in the podcast.
For example, if it was research on the effectiveness of a new medicine, it would NOT be acceptable to say “we have no analytically useful record” of whether patients actually took the medicine. Yet that seems to be ok for drawing conclusions from this study.
I haven’t read this post yet, but am here to say that it was shared today at the High School Math Subcommittee of the Math CICS meeting (the statewide group of folks who lead math at county offices). We are all now eager to read this post as we were talking about Sold a Story in our Meeting today.
Thank you, Allison. I’d love to hear what you all think once you’ve had a chance to check it out.
I really appreciate you doing this and I will keep checking in as the episodes are dropped. I have been listening and have the same big questions that you have….is direct instruction the same as explicit instruction? Also, I don’t think the podcast is very “explicit” about what this “direct instruction” looks like other than having a script….what does that script look like??? Lots of questions remain. I too am a big worried about what the outcome of all of this might be and am keeping a keen eye on the podcast and conversations around it! I’m not opposed to change but I need to see some hard proof and evidence.
Thanks for commenting, Elizabeth. One thing that I keep thinking about is that the threshold for “hard proof and evidence” varies wildly, from person to person.
To explain what I mean, let’s say that every single detail about Project Follow Through was EXACTLY the same except that instead of Direct Instruction, it was some kind of inquiry method that was considered best. Would I still question the data or say nothing because it supports my beliefs???
It reminds me of that quote: “There are three kinds of lies: lies, damned lies, and statistics.”
I would say that your conclusion #3 might be spot on. The bulk of this episode talks about the way Thaddeus Lott was an exceptional leader, held high expectations for his students, and built a culture where they felt valued and empowered. Reminds me of Robert Berry talking about being a “warm demander.” Lott did this often subversively and in the face of naked racism and extremely low expectations of “those kids” from affluent and powerful outsiders. It sounds like Lott bulit a culture that gave kids opportunity (going to Astros games and the Renaissance Festival) and where they might have the same teacher for three years in a row. He was a leader who looked like these students, likely shared a lot of cultural ties and background, and gave them a model of success. My wonderings are: 1) what evidence is there that it was the Direct Instruction that was responsible for this school’s success, as opposed it stemming from the school’s climate, cultural relevance, and structure? Or is it both, but maybe DI is given too much of the credit? 2) Nearly all of the comments cited in the episode have to do DIs effectiveness in reading (when coupled with this culture) but it is implied that DI was equally beneficial in every subject. We can see some evidence of that with the math test scores you cite, but again…how much of that was cultural and how much was pedagogical? and 3) is the implication or even the takeaway supposed to be DI is best for those “poor, Black kids?” and–if so–is there a risk that that will then become yet another sorting, organizing, and marginalizing mechanism that will give access to a certain kind of education to some kids and access to another kind to others? I’m wondering if there ARE dots to be connected here, but are the dots being connected for us by the podcast the right ones?
There’s so much to unpack in what you shared, Erin. At a minimum, we need to realize that we will never know for sure which conclusion is right. Very likely, it’s a combination of all three as well as other factors we’re oblivious to.
I also thought that the comments about going to Astros games and the Renaissance Faire seemed like a notable sign towards Conclusion #3.
It’s so hard to tell, but I fear that people will look at this data and come to whatever conclusions best suit their desires.
Thank you for your work fact-checking this podcast! I have many of the same thoughts as others who have commented as far as a definition of direction instruction (DI vs di vs ei). After episode 3, my conclusion was that good teachers can be effective with any curriculum. It all felt so nebulous. I’m from the Houston area, so episode 4 was especially interesting to me since there’s a “home town” connection. I was a student in Texas when TAAS was first implemented and then taught under TAKS and STAAR. I agree with your attempt to correlated state test scores to effectiveness of a program. One thing that may help is identifying the state average for each of those years so you have something to compare it to. Of course, everyone’s scores dropped when we switched to STAAR, but did Wesley drop more or less? At some point they started providing state average for like cohorts of schools, but I don’t remember when that was. It might also be helpful information. Again, thank you for all the work you have done – we appreciate you!
Thank you so much for this, Kristen. While data might seem to be objective truth, there is soooo much room for bias. For example, here’s a direct quote from the Episode 4 transcript:
“Wesley hadn’t become the best school in Houston. There were still about 20 schools — all with higher income populations — that were scoring better than Wesley. But Wesley was doing better than some schools in wealthy, white neighborhoods. And no school with as many kids from poor families was performing anywhere close.”
She said, “Wesley was doing better than some schools in wealthy, white neighborhoods.” But what does that even mean??? The word “some” could mean two or more. She’s not giving any numbers or sharing her data, so this is basically a throwaway statement.
OF COURSE Wesley is going to do better than at least two schools in “wealthy, white neighborhoods.” It’s freaking TEXAS. There are over 4000 public elementary schools in Texas!!! Wesley could rank 3998th out of 4000 schools and this could still be true. So why even make such a statement?
The podcast makes many claims like this one that are technically not lies, but without sharing their data, who knows what the real story is.
Was there a statewide drop in scores in 2012 when Texas changed their standardized test from TAKS to STAAR?
That would support your Conclusion B
From what I saw, yes, there was a statewide drop when Texas changed from TAKS to STAAR. But, perhaps it’s more nuanced than that. For example, if some schools drop more and some less, might that add additional meaning?
I’m not saying you’re wrong. I’m just trying to be as neutral as I can. It’s admittedly really, really hard to not add my own biases to the data interpretations.
Hi Robert, I’m assuming you’ve seen this but it’s also a very helpful post about the methodological flaws in Project Follow Through, from Rachel Lambert.
https://mathematizing4all.com/2026/10/25/project-follow-through-a-study-so-old-it-makes-me-look-young/
And this podcast episode is a really interesting history of Direct Instruction: https://soundcloud.com/haveyouheardpodcast/227-lessons-of-last-resort-the?si=2c0cab65ef794426aab64871d871516c&utm_source=clipboard&utm_medium=text&utm_campaign=social_sharing
Thanks for doing all this work!
Thanks for this, Heidi. Yes, I have read Rachel’s work. And she’s absolutely my inspiration for writing this blog at all.
I’ll try to check out that podcast ASAP.
I was a little disappointed that Episode 4 focused on literacy and not math. I am listening through a lens of being persuaded by the information and nothing in the episode makes a case for DI in math. The interviews do not have anyone talking about how they see themselves as mathematicians. The sound clips do not help me see if they are rote memorizing or gaining number relationship understanding. The Direct Instruction curriculum was specifically scripted based on their research about how students understand math. While there are still scripted curriculums, does this specific script still exist? This isn’t a teaching philosophy, it is a research based documented understanding of how students develop an understanding of numbers and the specific words and phrases that help students connect their understanding to the math. In the first episodes it references the importance of teacher PD around the script, what they learned in their research, and why things need to be spoken in that specific way. To me, this aligns more with our current research based understanding of how students develop mathematical reasoning that you will see from Pam Harris, Graham Fletcher, and Integrow Numeracy Solutions (formerly Math Recovery). Teachers need to understand how students think about number relationships so they can leverage that and move the student forward.
Hi Adrianne. There’s a lot to unpack here, but I will say that the scripted curriculum still exists and is actually published by McGraw Hill. I found it during my research here: https://www.mheducation.com/prek-12/program/microsites/direct-instruction.html
This is a link to a specific lesson: https://www.mheducation.com/unitas/school/program/connecting-math-concepts-2012/cmc-sample-level-f-lesson39.pdf
I have so many questions…
Interesting. Thanks for the links. I will also leave it at I have so many questions…