
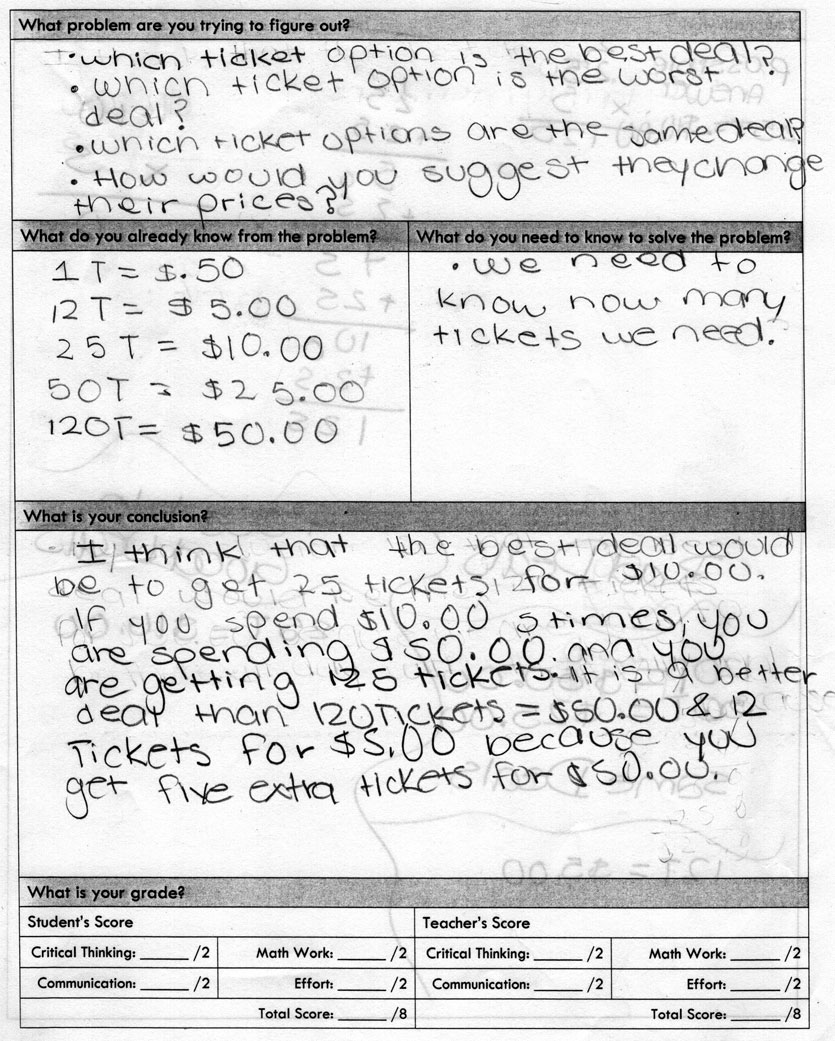
- Which ticket option is the best deal?
- Which ticket option is the worst deal?
- Which ticket options are the same deal?
- How would you suggest they change their prices?
- How did you reach that conclusion?
- Does anyone else have the same answer but another way to explain it?
I’ve written a blog post the more fully explores the ups and downs of implementing a lesson like this here.
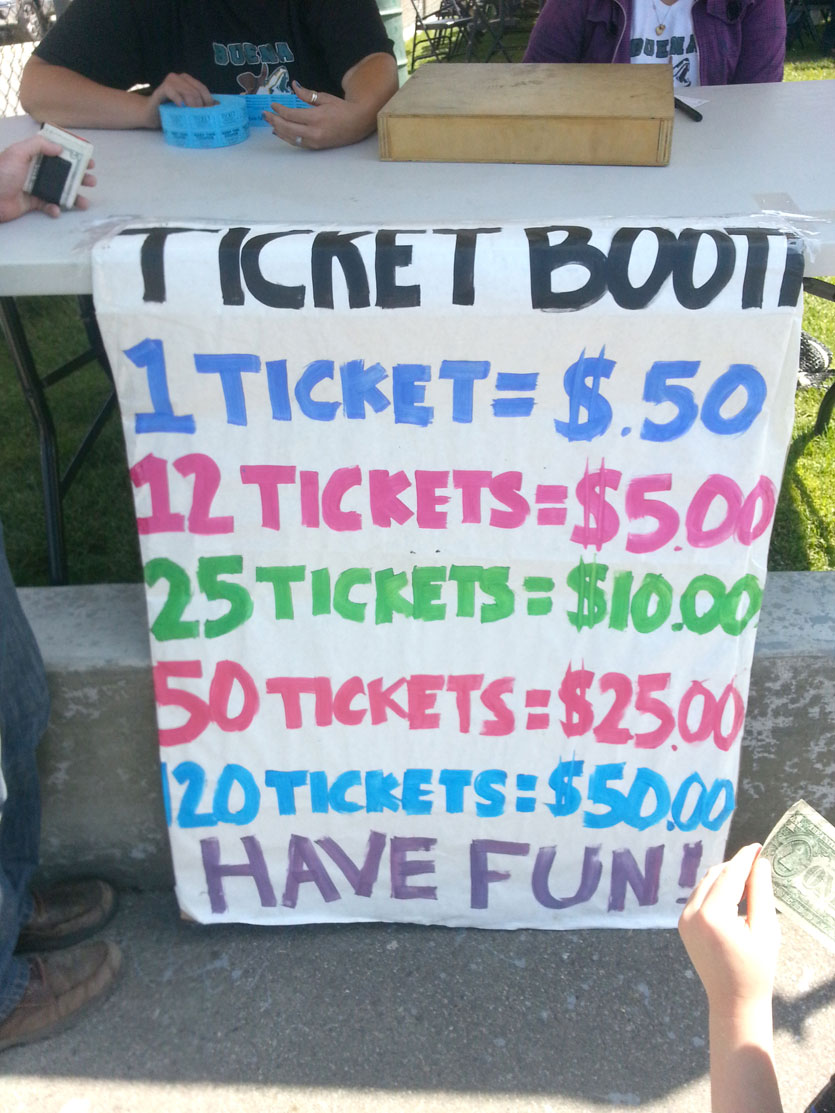
Looking at the painted ticket booth chart above, it is clear that you are getting a better deal if you buy 12 tickets instead of 1 as well as 25 tickets instead of 12 tickets. However something strange happens when you consider purchasing 50 tickets instead of 25 tickets. You can buy the 25-ticket option twice for $10 each time which gives you 50 tickets for $20. Alternatively, you could buy the 50-ticket option for $25 and spend $5 more for the same number of tickets.
There are other interesting pricing options such as:
- 12 tickets for $5 and 120 tickets for $50 (same price per ticket)
- 1 ticket for $0.50 and 50 tickets for $25 (same price per ticket)
- 5 sets of 25 tickets for $50 or 120 tickets for $50 (still cheaper to buy sets of 25 tickets)
The chart below lists the cost per ticket for each ticket option:
Looking at the chart, is is easy to see that the 25 tickets for $10 is the best deal. Tied for the worst deals are $0.50 for one ticket and $25 for 50 tickets. However, you could make the case that the $25 for 50 tickets is worse in that you could have bought the tickets one at a time to have just the right amount. The same deals are the $5 for 12 tickets and the $50 for 120 tickets as well as the two worst options.
Encourage students to defend their reasoning using multiple explanations and discuss how they are connected. For example, students could talk about the ticket options in terms of unit rate. That makes it really easy to compare multiple ticket options, but is not easy to do when you are waiting in line to buy tickets. Alternatively students could try to make comparable ratios which is easier to do in line, but more challenging to compare all the ticket options against each other.
For the extension challenge, “How would you suggest they change their prices?”, I intended it as a way for students to change the pricing structure so that the price per ticket decreases with the more tickets you buy. Students may not realize that they can accomplish this by either lowering the total cost or increasing the number of tickets. They should be able to explain their reasoning and show that the cost per ticket decreases when you buy larger quantities of tickets.
Ultimately, it is unclear whether the pricing structure is a mathematical mistake where students did not realize that the they are discouraging customers from buying large amounts of tickets, or whether it is a shrewd business move where students are taking advantage of customers with poor math skills who assume that larger quantities come with lower prices. Either way, it is a good example of real world math skills helping you make educated decisions.
- Low
- Low
- Medium
- Medium
- High
- High
- CCSS 6.RP.2 Understand the concept of a unit rate a/b associated with a ratio a:b with b ≠ 0, and use rate language in the context of a ratio relationship. For example, “This recipe has a ratio of 3 cups of flour to 4 cups of sugar, so there is 3/4 cup of flour for each cup of sugar.” “We paid $75 for 15 hamburgers, which is a rate of $5 per hamburger.”1
- CCSS 6.RP.3 Use ratio and rate reasoning to solve real-world and mathematical problems, e.g., by reasoning about tables of equivalent ratios, tape diagrams, double number line diagrams, or equations.
- CCSS 6.RP.3a Make tables of equivalent ratios relating quantities with whole-number measurements, find missing values in the tables, and plot the pairs of values on the coordinate plane. Use tables to compare ratios
- CCSS 6.RP.3b Solve unit rate problems including those involving unit pricing and constant speed. For example, if it took 7 hours to mow 4 lawns, then at that rate, how many lawns could be mowed in 35 hours? At what rate were lawns being mowed?
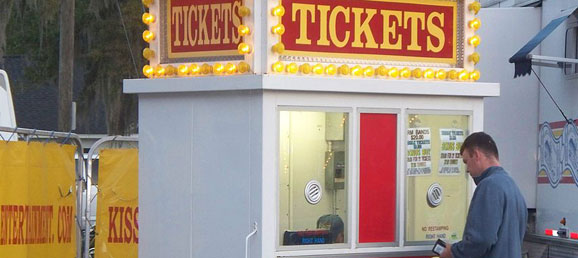
- High school carnival ticket booth picture
Love this! I spent two days doing this with my students. They worked in groups of 3-4. Day 1 was all of this as directed. Day 2 was my students coming up with their own pricing scale for whatever they wanted to sell tickets for (basketball game, raffle, carnival, cupcakes, etc.). They created a poster with their pricing scale, taped them around my room, and the groups went around the room to see which group had the best deal for tickets. They had to find the unit rate several times throughout the two days. When my students asked questions, I answered them with a question. This was such a great two days in my classroom! Thanks for this!
What a great modification. Thanks for sharing this tip with us so everyone can read it! Glad it went well.