
[This is one of a series of posts that explore real world examples of mathematical modeling to help educators better understand its applications. To learn about Spies and Analysts, I recommend either reading this blog post or watching this webinar (with elementary, middle, and high school versions).]
For years I’ve been trying to find a way to talk about mathematical modeling that made sense to me. I’ve finally found something I’m happy with and it has to do with the differences between spies and analysts. I’m sure this sounds strange, so let me explain.
The United States’ Central Intelligence Agency (CIA) is responsible for acquiring and using information to help American causes. There are two main groups in this agency: the people who acquire information (we’ll call them spies) and the people who break down and connect the information (we’ll call them analysts). Both are important because having more intelligence about what others are doing allows the United States to make more informed decisions. Let’s consider how this played out in both World War 2 and September 11th.
Now let’s consider September 11th. What if we had more spies gathering information about what was going to happen? Would that have helped? It may seem like it would have, but unfortunately it wouldn’t have been as valuable as having more analysts.
Prior to the attack on 9/11/2001, the US intelligence community had received many tips about suspicious activity. For example, they knew about suspected terrorists who had been receiving flight instruction. So, in this case, the issue wasn’t that the information wasn’t available. The issue was that there weren’t enough analysts to take the information they received and determine what was useful and what was unimportant.
So, the way I see it, there are two primary components in this process:
- Spies figure out what information is needed and acquire it
- Analysts take the given information and work with it
Hopefully what results is actionable information that gives the US intelligence community what they want. If it doesn’t, then they need to modify their plans and look at where the process broke down. Was it an issue of the spies not getting the necessary information? Was it instead that the information was there but the analysts didn’t put it together?
The takeaway here is that we need a combination of both spies and analysts to find success. Interestingly, I believe that this structure of spies and analysts is very useful for gaining deeper understanding of mathematical modeling. To explain what I mean, let’s consider how we predict weather and earthquakes.
Now let’s think about how we predict earthquakes. Right now, we’re pretty awful at figuring out when future earthquakes will take place. We know that they will happen, but we can’t tell if they will take place in a week, a month, a year, a decade, or a century. So, how can we improve? Should we be investing in better spies or analysts? In this case, the problem is with our spies, not our analysts. Earthquakes happen so rarely that it’s hard to capture data on them. We have seismographs to measure earthquakes, but is that the best we can do? What about how animals seem to go crazy before an earthquake. Could there be other available data that our spies are not aware of or are not currently able to capture? Even if you come up with a highly accurate formula for predicting earthquakes, they happen so rarely that it makes it really challenging to fine tune it.
So, with mathematical modeling:
- Spies figure out what information is needed and acquire it
- Analysts take the given information and work with it
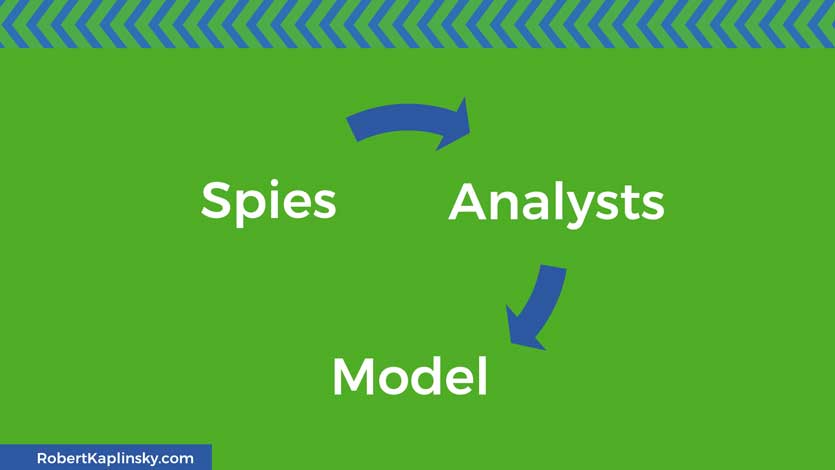
First comes the spies who figure out what information is needed and acquire it.

Next comes the analysts who take the given information and work with it to figure out what to keep and how to use what remains.
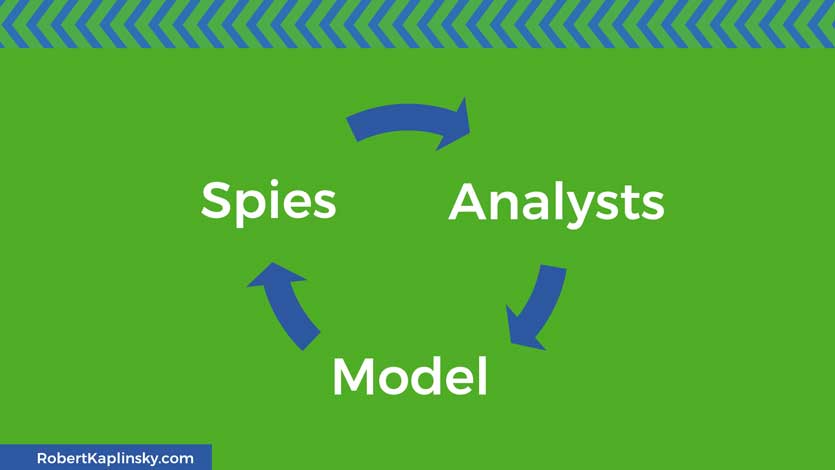
Now you have a mathematical model created by the analysts using the information acquired by the spies. At this point, you can use the model and verify if it works. For example, does it actually predict the weather or earthquakes?
If it needs modifications (and almost all real mathematical models do) then it’s time to start the process over again. The spies will verify that they have the right information and the analysts will consider other ways of using the provided information.
This is really great and has helped me wrap my mind around SMP4. I haven’t read the target article, but it is an enticing cliff hanger. I did, however, recently read Moneyball by Michael Lewis and about 50 pages in it finally dawned on me that they were creating a model. In fact, they use the word model frequently when discussing baseball stats, because that is basically what they are; de-contextualized numbers we can gather from real players and toy with in the hopes of winning more games!
Thanks Joshua. Yes, I reference Moneyball in a presentation I do as they created a mathematical model to figure out which baseball players are better than people realize. Based on my current understanding of mathematical modeling though, I would not consider the individual stats to be the model but rather a data point that spies might pass to the analysts when creating the model.
What if we, as educators, consider ourselves both spies and analysts, building models of what students understand? Spies, in that we are observing mathematical behaviors of students; analysts, in that we take that information and work with it. A large part of quality teaching is working with students where they are, not just shooting a bunch of knowledge out into the void and hoping kids catch it. Building “second-order-models” of student understanding is vital, but this takes a lot of questioning, listening, observing, and analyzing in order to make good instructional decisions.
I like your analogy and how it leads to building mathematical models. Would love to know your thoughts on applying the same analogy to building models of student understanding.
Thanks for your work.
I don’t see why it couldn’t work. For example, as teachers we are making real-time decisions as to where and how we spend our time an energy when we are with the classrooms. Without realizing it, we are constantly adjusting the relative weighting of what we see. For example, in some situations, a kid who is off task might be something we address. Other days we might have too many things going on and focus elsewhere.
Nice call.
Grading is definitely a mathematical model of performance, something that occurred to me out of the blue one day.
Of course it is. We assign values to an assignment based on its importance and then put student performance on a scale. The percentage generated comes straight out of those choices.
For this reason, 0.01 or 0.1 difference between an A and a B is meaningless, as models can be easily tweaked.
Are assessment and teaching models? I have to give that more thought.
I feel like grading is less a model then it could be. It’s really just an accumulation of data points. Grades could be the data spies gather but then someone would need to analyze them to create something new from that to consider it a model.
It is interesting that you make reference to mathematics and World War II. While many are aware of John Von Neumann’s mathematical contributions to work on the Manhattan Project. However, few are aware that he created mathematical models to plan out the path the bombers carrying the bombs would take to minimize their chances of being shot down.
I had never heard that story John. That’s a neat addition!
Hi Robert-
I have really enjoyed reading your posts about mathematical modeling. I was wondering if you could give an example of what modeling would look like in the primary grades. Thanks.
Hey QB. Check out this webinar: https://robertkaplinsky.com/webinar-es. It has an elementary example in it.
I want to dig into the Spies/Analysts/Modeling phase. The work of Analysts needs some unpacking because the decisions made here impact the results so profoundly.
It reminds me of a Thompson’s grain silo problem. Thompson posed a group of 5th graders from a farming community the conundrum of deciding and quantifying when and how silo explosions happened. The kids knew that grain dust, dryness, and the height of the grain were factors. Step 1 is quantifying and naming the units. I don’t remember the exact details, but all of the factors they noted could be measured.
Grain dust can be measured as parts per million.
Humidity has a measure and scale.
Height of the grain can be it’s volume. Possibly, or the volume of the space between the grain and the top of the silo.
No matter the details, the students recognized that low humidity was a contributing factor so the model reflects that. The “dustiness” of some grains over others contributes more to the risk of explosion, and having less space in the silo above the grain also contributes to the risk. The model generates A SINGLE number that reflects the the risk, which at first has no context. Through experience, the number generated can be placed on a scale of Grain Silo Explosion Risk.
This makes me think of other scales that acquire meaning only with experience with the model: SAT scores, Apgar scores, many of the stats generated from blood tests such as white blood cell count, etc.
In any case, my original point is that forming the mathematical model expresses relationships quantitatively by collecting “extensive“ quantities and marrying them together with some operation to create “intensive” quantities. This is a multiplicative relationship. What if we wanted factors to have less dependence on each other – would an additive relationship better represent what’s happening? What if the relationship is better expressed as an exponential one? The huge questions about operations and operation sense that arrive out of this issue are really interesting.
Thanks Kim. I love your questions. So one thing is that in the way I conceive of Spies and Analysts, I would consider the “quantifiying and naming the units” to be part of the Spies’ job. Any data collection including what data should be collected is part of the Spies. Deciding what to do with the data is the Analysts.
That being said, yes, figuring out what to pay attention to and what to ignore is some of the most challenging aspect of the Analyst work. I don’t think we give students enough time playing around with huge questions like the one you shared.
I enjoyed this post and especially enjoyed the link about potential terrorists attending flight schools. One of my favorite resources is The Numbers Behind Numb3rs: Solving Crime with Mathematics by Devlin https://www.goodreads.com/book/show/914664.The_Numbers_Behind_Numb3rs. This book has been a great resource in the my statistics classes and fits in well with your spies & analysts examples. Also, you may have a broken link to the information about animals going crazy before earthquakes. I was not able to get it to work.
Thanks Scott. I appreciate this connection. I fixed the link for the animals as well. Apparently the site was updated.
It is similar to the difference between understanding how to do a problem with the available information and an in-depth understanding of how the concepts fit into the overall scheme of mathematics and the limitations and links arising from this.
There are many teachers and students who limit the definition of understanding to being able to apply a process correctly in problem-solving. It ignores the context and development of the processes and hence the links and limitations.
Agreed, Anna. It makes you really get to the core of what it means to understand mathematics. In related news, you might like this blog and video: https://robertkaplinsky.com/what-does-it-mean-to-understand-mathematics/